Introduction
Working capital definition and example
Working capital is defined as current assets minus current liabilities. For example, if a company has current assets of $90,000 and its current liabilities are $80,000, the company has working capital of $10,000.
Note that working capital is an amount. Some of the factors that determine the amount of working capital needed include:
- Whether or not a company needs to have an inventory of goods
- How fast customers pay for goods or services
- How fast the company must pay its suppliers
- The company’s growth rate
- The company’s profitability
- The company’s ability to get financing
Working capital can be increased by:
- Profitable business operations
- Sale of long-term assets
- Long-term borrowings
- Investment by owners
Working capital can decrease from:
- Unprofitable business operations
- Purchasing long-term assets (without long-term financing)
- Repaying long-term debt
- Distributing cash to owners
Liquidity definition
Liquidity is having the money to pay the company’s obligations when they are due. In other words, it is the company’s ability to convert its current assets to cash so that the current liabilities can be paid when they come due. Liquidity is necessary for a company to continue its business operations.
Liquidity could increase by:
- Increasing working capital (see the above list for increasing working capital)
- Increasing the speed at which current assets are converted to cash
- Delaying the payment of current liabilities
- Delaying the payment of long-term liabilities
- Omitting the distribution of cash to owners
Liquidity could decrease from:
- A decrease in working capital (see the above list for decreasing working capital)
- Purchasing and/or producing too many items for inventory
- A slowdown in the speed at which current assets are converted to cash
- Paying current liabilities too soon
Working capital vs. liquidity
A retailer, distributor or manufacturer may have a large amount of working capital. However, if most of its current assets are in slow-moving inventory, the company may not have the liquidity to pay its obligations on the agreed upon due dates. Similarly, if a company is unable to collect its accounts receivable, it may not have the liquidity to pay its obligations.
In contrast, consider a company that sells popular products online and customers pay with bank credit cards or debit cards when they order. Further, the company’s suppliers allow the company to pay 60 days after it purchases the products. This company may have very little in working capital, but it may have the liquidity it needs.
Financial ratios and other metrics
There are some financial ratios and metrics that are closely related to working capital and liquidity, such as:
We will discuss and calculate each of these. We will also point out that if these metrics are calculated by using the amounts from a company’s financial statements, the amounts are likely from the prior year. Further, the amounts reported on the financial statements are highly-summarized. Hence, some unusual transactions and amounts will likely be hidden or buried by the enormous number of normal transactions.
People within a company will have access to more current amounts and more detailed information that can be sorted, reviewed and analyzed. Therefore, people within a company will gain more insights from the detailed internal information than someone calculating financial ratios by using the amounts reported on the prior year’s published financial statements.
Finding the root cause
It is also important to understand the root cause for a change in working capital and/or liquidity. In the case of a liquidity problem, you should “drill down” by asking “Why has liquidity decreased?” You may discover a decrease in the company’s accounts receivable turnover rate and an increase in its average collection period. Next ask “Why is there a decrease in the turnover rate and the increase in the average collection period?” You may find that two large customers have slowed their remittances of the amounts they owe.
That should lead to another question: “Why is Customer X not paying according to the agreed-upon terms?” The answers could range from the customer is having financial difficulty to the customer is not pleased with the company’s products or service. That should lead to yet another “Why?” question. The goal is to get past the symptoms and get to the root cause.
Similarly, if the decreases in working capital and/or liquidity are due to unprofitable business operations, a person should also begin a series of “Why?” questions. The answers may lead to an urgent need for an immediate reduction in expenses lest the company is forced to stop operating. Eliminating operating losses is also important for ongoing relationships with lenders, suppliers, customers, employees, owners and more.
Cash is king
“Cash is king” is a popular phrase for several reasons. One reason involves liquidity: cash is necessary to meet Friday’s payroll, to make a loan payment, to pay suppliers, to remit payroll taxes, etc.
Another reason for “cash is king” pertains to the accrual method of accounting. Under this generally required method of accounting, a company’s financial statements will report revenues and the related receivables when they are earned (not when the customers’ cash is received). Further, expenses and liabilities are reported when they are incurred (not when the cash is paid out). Because of the judgements used in determining when the revenues and expenses are reported on the income statement, there is a concern with this perceived “flexibility”. With cash there are no judgments or estimates involved. The company either has the cash or it doesn’t.
Fortunately, companies are required to include the statement of cash flows (SCF) whenever its financial statements are distributed. The SCF will report the major cash inflows and cash outflows during the same period as the income statement. The SCF also reconciles the change in a company’s cash during the past year. Since liquidity involves cash, you will gain valuable insights by understanding the SCF.
WATCH NOW
Advance Your Career with Our PRO Training
Components of Working Capital
Working capital (also known as net working capital) is defined as current assets minus current liabilities. Therefore, a company with $120,000 of current assets and $90,000 of current liabilities will have $30,000 of working capital. A company with $100,000 of current assets and $100,000 of current liabilities has no working capital. As you can see, working capital is an amount even though it is usually discussed as part of financial ratios.
Current assets
A major component of working capital is current assets. A shortened definition of current assets is: a company’s cash plus its other resources that are expected to turn to cash within one year.
However, the following is a more complete definition:
Current assets include cash (which is not restricted for a long-term purpose) plus the company’s other resources that will turn to cash or will be used up within one year (of the date shown in the heading of the balance sheet). However, in the rare situations when a company’s normal operating cycle is longer than one year, the length of the operating cycle is used in place of one year for determining a current asset.
Examples of current assets (listed in the order they are expected to turn into cash) include:
Current liabilities
The other major component of working capital is current liabilities. A shortened definition of current liabilities is: a company’s obligations that will be due within one year.
However, a more complete definition is:
Current liabilities are a company’s obligations (that are the result of a past event) that will be due within one year of the balance sheet’s date. However, in the rare situations when a company’s normal operating cycle is longer than one year, the length of the operating cycle is used in place of one year for determining a current liability.
Examples of current liabilities include:
If there is assurance that a current liability will be replaced by a long-term liability, it should be reported as a long-term liability. (The reason is the liability will not be requiring the use of the company’s working capital.)
Operating cycle
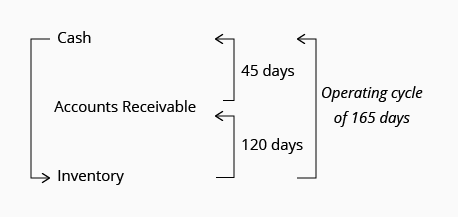
For a complete understanding of working capital, current assets, and current liabilities, it is necessary to understand the term operating cycle. A company’s operating cycle is the average amount of time it takes for the company’s cash to be put into the business operations and then make its way back into the company’s cash account. To illustrate, let’s assume that a distributor of products experiences the following:
- It uses its cash to purchase inventory items
- It takes on average 120 days to get the items sold by offering credit terms of 30 days
- On average, the company receives the money from these customers 45 days after the sales occurred (even though the credit terms were 30 days)
With these conditions, the distributor’s operating cycle is on average 165 days, as illustrated here:

Throughout this topic you should assume that the companies we are discussing have:
- operating cycles of less than one year
- insignificant amounts of supplies and prepaid expenses
Reporting Working Capital, Current Assets, Current Liabilities
Working capital
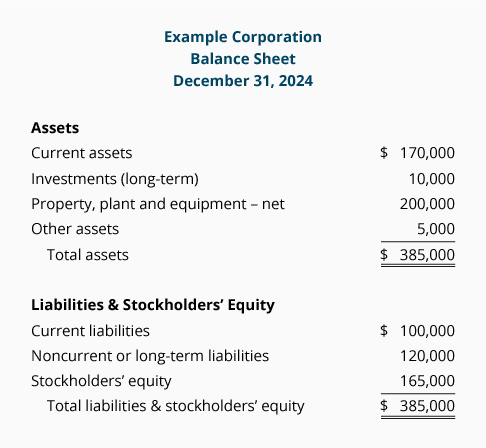
Typically, a company issues a classified balance sheet, which means it has several classifications (or categories) of assets and liabilities. The typical classifications are shown in this condensed balance sheet:

The classified balance sheet allows users to quickly determine the amount of the company’s working capital. Using the amounts from the above balance sheet, we have:
Working capital = $170,000 of current assets minus $100,000 of current liabilities = $70,000
A company’s working capital must be managed so that cash will be available to pay the company’s obligations when they come due. This is important for:
- having a positive relationship with creditors, employees, and others
- complying with the terms and conditions in a loan agreement
- maintaining an excellent credit rating
The amount of working capital that is needed by a company depends on many factors. One factor is the company’s size. For example, $70,000 of working capital could be sufficient for a company with current liabilities of $100,000; however, a larger company having current liabilities of $600,000 is likely to need more than $70,000 of working capital.
A second factor is the speed at which a company’s current assets can be converted to cash. For instance, if a company has $170,000 of current assets but most of the amount is in slow-moving inventory, the company may not be able to convert the inventory to cash in time to pay the current liabilities when they come due. Not paying some obligations on time can have severe consequences.
A third factor influencing the required amount of working capital is the company’s ability to borrow money. For example, a company with a preapproved line of credit that can be used when needed allows the company to operate with a smaller amount of working capital.
Other factors include the credit terms that are allowed by the company’s suppliers, the company’s profitability and growth rate, the time required to complete a customer’s order, and more.
Current assets
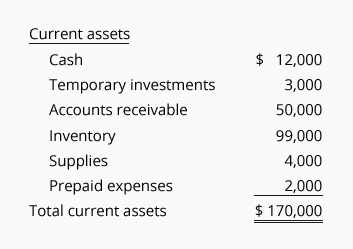
An example of the current asset section of a balance sheet for a company selling goods on credit is shown here:

The current assets are listed in the order in which they are expected to be converted to cash. Accountants refer to this as the order of liquidity. Since cash is the most liquid asset, it is listed first. (Large companies often expand the description to be cash and cash equivalents.)
Cash includes a company’s currency, coins, petty cash fund, general checking account, payroll checking account, money received from customers but not yet deposited, etc. The $12,000 shown above as “Cash” is the sum of those items.
Temporary investments include short-term certificates of deposits and securities that can be readily converted into cash.
Accounts receivable – net is the amount that a company currently expects to receive from customers who purchased goods or services on credit. It consists of the amount the customers owe minus an estimated amount that will not be collected. To illustrate, let’s assume that the general ledger account entitled Accounts Receivable has a balance of $54,000. (This is the company’s sales invoices which have not yet
been paid by the customers.) If the company estimates that $4,000 will never be collected, the account Allowance for Doubtful Accounts will report a credit balance of $4,000. The net of these two account balances is $50,000 ($54,000 minus $4,000) which is listed after cash and temporary investments.
Inventory (goods held for sale) is listed after accounts receivable since it usually takes many months for a company to convert its inventory into cash.
Supplies is similar to inventory. Supplies could include packaging materials, shipping supplies, etc.
Prepaid expenses often include annual memberships, annual service contracts, and insurance premiums that were paid in advance. To avoid paying in advance, a company may be able to arrange for automatic monthly charges.
Having the current assets listed in their order of liquidity gives the readers of the balance sheet some idea of the company’s ability to pay its obligations when they come due.
Current liabilities
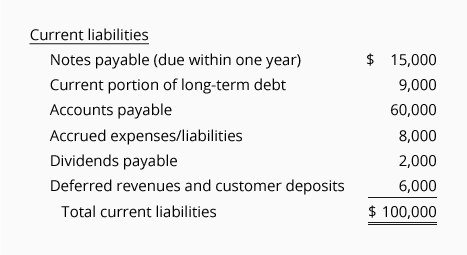
The following is an example of the current liabilities section of a company’s balance sheet:

As is the case with most amounts reported on the financial statements, the current liability amounts are the sum of the balances in many general ledger accounts. For example, the one line “Accrued expenses/liabilities 8,000” included above may be the sum of the balances in the following general ledger accounts:
- Accrued Wages Payable
- Accrued Payroll Taxes
- Accrued Employee Fringe Benefits
- Accrued Utilities Payable
- Accrued Repairs and Maintenance
- Accrued Advertising Expenses
- Accrued Professional Fees Payable
- Accrued Interest Payable
Interestingly, the current liabilities are not reported in the order in which they are due. In our example we listed the written promises first, accounts payable second, and then the remaining current liabilities. Another practice is to list the accounts payable first, the written promises second, and then the remaining current liabilities.
Since the current liabilities are not listed in the order in which they are due, a note payable that will be due in 11 months could appear first and the payroll taxes that are due in two days could be included in the fourth item.
Technology and working capital
Technology allows some companies to operate with less working capital than was needed in the past. Take for example a company that sells high demand products on its website with customers paying with credit cards at the time they place an order. The company will receive a bank deposit from the credit card processor within a few days of the sale. It is also possible that the company is allowed to pay its suppliers
30 days after receiving the products that will be sold in a few days.
Some companies use a business credit card to pay for the goods and services it receives. The company then has 27 to 57 days to pay the credit card company, depending on the date of the credit card statement.
These examples show how technology can speed up the conversion of a company’s current assets to cash or how the company can delay the payment of cash for some purchases. Both will improve the company’s liquidity without increasing the amount of working capital.
Accrual Method of Accounting
Under the accrual method (or accrual basis) of accounting the current asset accounts receivable is reported on the balance sheet when an amount has been earned. The amount earned is also reported as revenue on the income statement. When the company receives the money, accounts receivable will decrease and cash will increase.
Under the accrual method the current liability accounts payable (or accrued liabilities/expenses) is reported on the balance sheet when a liability has been incurred. If an expense is involved, the expense is also reported on the income statement. When the company pays the amount owed, accounts payable will decrease and cash will decrease.
Throughout this topic and in nearly all accounting textbooks, it is assumed that the accrual method of accounting is being followed. In short, the accrual method is the standard method to be used when financial statements are distributed to people outside of the company. (Income tax reporting may be different especially for small businesses.)
Changes in the Amount of Working Capital
A company’s profitability is likely to be the most important influence on the amount of its working capital. A highly profitable company’s operations may generate enough working capital that it can avoid the need for loans and/or additional money from investors.
In contrast, a company with significant operating losses may cause the company’s working capital to shrink rapidly. A significant loss of working capital could result in violating existing loan agreements, being unable to obtain additional loans or attract investors, perhaps lose the ability to purchase goods with credit terms of 30 days, etc. Unprofitable business operations combined with the loss of working capital could jeopardize the company’s ability to continue operating.
Since working capital is defined as current assets minus current liabilities, the increase or decrease in working capital will result from transactions outside of the current assets and/or current liabilities. Below are some transactions that often cause a change in the amount of working capital (WC):
Noncurrent (long-term) asset transactions:
- Purchase of property, plant and equipment (causing WC to decrease)
- Sale of property, plant and equipment (causing WC to increase)
- Purchase of a long-term investment (causing WC to decrease)
- Sale of long-term investment (causing WC to increase)
Noncurrent (long-term) liability transactions:
- Proceeds from long-term loans (causing WC to increase)
- Repayment of long-term loans (causing WC to decrease)
Stockholders’ equity transactions:
- Profits from its business operations (causing WC to increase)
- Losses from its business operations(causing WC to decrease)
- Proceeds from issuing capital stock (causing WC to increase)
- Distribution of dividends (causing WC to decrease)
- Repurchase of capital stock (causing WC to decrease)
Since working capital is defined as current assets minus current liabilities it will mean that:
-
If a company uses $1,000 of cash to pay $1,000 of its accounts payable, there is no change in the total amount of working capital. (Both the current assets and the current liabilities decreased by the same amount.)
-
If a company collects $2,000 of its receivables, there is no change in the total amount of working capital. (The current asset cash will increase by $2,000 and the current asset accounts receivable will decrease by $2,000.)
In other words, transactions which affect only the working capital accounts will not change the company’s total amount of working capital.
Liquidity
Liquidity definitions and examples
Liquidity is a company’s ability to pay its obligations when they are due. Expressed another way, liquidity is the company’s ability to convert its current assets to cash before its current liabilities must be paid.
The first section of most balance sheets will report a company’s current assets in their order of liquidity. This means that cash will appear first, followed by the remaining current assets in the order in which they are expected to be converted into cash. (The current liabilities which must be paid are not listed in the order in which they are due.)
Importance of liquidity
To demonstrate the importance of liquidity, we will use a fictitious business called “Example Company”. Let’s assume that Example Company’s suppliers have given it credit terms that allow 30 days in which to pay. If Example Company does not have the liquidity to pay the suppliers’ invoices in 30 days, the suppliers may be concerned about Example Company’s financial condition. In response, a supplier might require Example Company to become current on all unpaid invoices before the supplier will ship any additional goods. A different supplier may shorten the credit terms for Example Company from 30 days to 10 days or may require cash on delivery. If Example Company loses its ability to pay on credit terms, its cash and liquidity will shrink.
Failure to pay obligations on time may also harm a company’s credit rating. This in turn may discourage other suppliers (and lenders) from extending credit to the company.
If a company has borrowed money, the loan agreement may require that the company maintain a minimum amount of working capital and/or maintain certain financial ratios. Being in violation of a loan agreement can have serious ramifications.
On a positive note, a company with ample liquidity can take advantage of special purchasing opportunities, take early payment discounts when offered, and save time by not having to decide which vendors and bills should be paid or delayed.
The importance of a company’s liquidity is evident by the financial reporting requirements for publicly-held corporations. Each of these corporations must include in its annual report to the U.S. Securities and Exchange Commission (Form 10-K) a discussion of its liquidity. Typically this discussion will reference amounts contained in the corporation’s statement of cash flows. Business people of all backgrounds should become familiar with the statement of cash flows since a company’s liquidity depends on its cash flows.
Improving liquidity
Both a company’s liquidity and the amount of its working capital can be increased through:
- Profitable business operations
- Sale of long-term assets
- Long-term loans
- Additional investments by owners
It is also possible to improve a company’s liquidity without increasing the amount of working capital by the following actions:
- Increasing the speed in which current assets are converted to cash
- Speeding up the collection of accounts receivable
- Purchasing or producing more optimum quantities for inventory
- Requiring smaller customers and new customers to use a credit card instead of the company granting credit terms
- Delaying the payment of current liabilities
- Not remitting money to vendors until the due date
- Arranging with vendors for longer credit periods
- Using a business credit card whenever possible
- Delaying the payment of long-term liabilities
- Reducing or omitting the distribution of cash to owners
- Obtaining a pre-approved line of credit that can be used when necessary
- Arranging for monthly installments instead of prepaying insurance premiums, maintenance contracts, memberships, etc.
Working Capital Ratios
In addition to calculating the amount of working capital, it is common to compute two related financial ratios:
- Current ratio
- Quick ratio
Current ratio
The current ratio, which is sometimes referred to as the working capital ratio, is calculated by dividing a company’s current assets by its current liabilities. The current ratio computed by using the amounts on our earlier condensed balance sheet is:
Current ratio = current assets of $170,000 divided by the current liabilities of $100,000 = 1.7, or 1.7:1, or 1.7 to 1
The current ratio allows for a comparison between companies of different sizes. However, knowing a company’s current ratio and its amount of working capital is still not enough. It is also important to know when the individual current assets will be turning to cash and when the current liabilities will need to be paid.
To illustrate the importance of knowing when the current assets will turn to cash and when the current liabilities are due for payment, let’s compare two companies of similar size and growth potential:
Company A sells fast-selling products online and requires customers to pay with a credit card when ordering. Hence, within a few days after an online sale takes place, Company A receives a bank deposit from the credit card processor. Company A is also allowed to pay its main supplier 30 days after receiving the supplier’s goods and invoice.
Company B sells slow-moving products to business customers who pay 30 days after receiving the products. Unfortunately, Company B must pay its suppliers within 10 days of receiving the products it had ordered.
Since Company A’s cash will flow in faster and will flow out slower than Company B’s, Company A can operate with a smaller current ratio and a smaller amount of working capital than Company B.
Quick ratio
When a company sells goods (products, component parts, etc.) there is a concern that its items in inventory will not be converted to cash in time for the company to pay its current liabilities. Hence, the company could have difficulty making its loan payments, paying its suppliers and employees, remitting employees’ payroll withholdings, etc. In short, when a company has inventory, there is a concern about the company’s liquidity.
This concern has led to the quick ratio (or acid test ratio) which excludes inventory, supplies and prepaid expenses. Therefore, the quick ratio is more conservative than the current ratio and will be calculated by using the following amounts:
- Only the “liquid” current assets (the ones that can be quickly converted to cash)
- The total amount of current liabilities
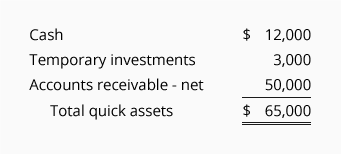
From our earlier list of current assets the “quick assets” as of the balance sheet date were:

This $65,000 of quick assets will be divided by the total amount of current liabilities, which were $100,000:
Quick ratio = $65,000 of quick assets divided by $100,000 of current liabilities = 0.65, or 0.65:1, or 0.65 to 1
(Note: Since inventory was a significant current asset, the quick ratio is significantly smaller than our earlier calculation of the current ratio which was 1.7, or 1.7:1, or 1.7 to 1.)
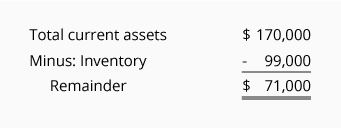
Some people calculate the quick ratio by merely subtracting the inventory amount from the total amount of current assets:

By not subtracting supplies and prepaid expenses from the total current assets, this quick ratio will be slightly less conservative than the quick ratio of 0.65 computed above:
Quick ratio = $71,000 divided by the $100,000 of current liabilities = 0.71, or 0.71:1, or 0.71 to 1
Accounts Receivable: Turnover, Other
When a company sells goods (and/or services) and allows its customers to pay at a later date, the company’s accounts receivable or trade receivables will be increased at the time of the sale. From the time of the sale until the money is received, the company is an unsecured creditor of the customer. Therefore, every company needs to be cautious when shipping goods on credit since it could result in a loss of both working capital and liquidity if the company is not paid.
To assess a company’s ability to convert its accounts receivable to cash during the prior year, it is common to compute the following:
- Accounts receivable turnover ratio
- Average collection period (or days’ sales in accounts receivable, and other names)
Accounts receivable turnover ratio
The accounts receivable turnover ratio (or receivables turnover ratio) relates the following amounts:
- the amount of net credit sales during a prior year
- the average amounts in accounts receivable during the same year
To illustrate the calculation of the accounts receivable turnover ratio, let’s assume that the company’s net credit sales during the most recent year were $1,000,000 and the average of the balances in accounts receivable throughout the year amounted to $125,000. Based on these amounts, we have:
Accounts receivable turnover ratio = net credit sales of $1,000,000 divided by the average balance in accounts receivables of $125,000 = 8 times
This calculation tells us that on average the accounts receivable turned over 8 times during the previous year.
This turnover ratio is an average because some of the accounts receivable may have turned over (were collected) within 30 days of the sale, some within 31-60 days of the sale, and some receivables continue to be past due for more than three months.
Caution when using amounts from annual financial statements
When the accounts receivable turnover ratio is calculated using amounts reported on a company’s published annual financial statements, there are some precautions:
-
The amounts reported in the financial statements reflect the transactions and balances that occurred in a prior year. Business conditions may have changed since the time of those transactions
-
Since the amounts on the financial statements are highly summarized, some unusual transactions and amounts could be buried among the many routine transactions
-
A company’s income statement may report only the total amount of sales without disclosing the amount of net credit sales. As a result, some people will relate the reported total sales to the average balance of the accounts receivable (which contains only the amount of the unpaid credit sales). This is a problem when a significant portion of the company’s sales were for cash or involved credit and debit cards
-
The balance sheet reports the amount of accounts receivable as of the final moment of the accounting year. Since U.S. companies often end their accounting year at the slowest time of their business year, the end-of-the-accounting-year balances are not indicative of the receivable balances in the months when there is much more business activity. This is the reason for using the average amount of accounts receivable during the entire year. Averaging two end-of-the-accounting-year balances does not resolve this problem.
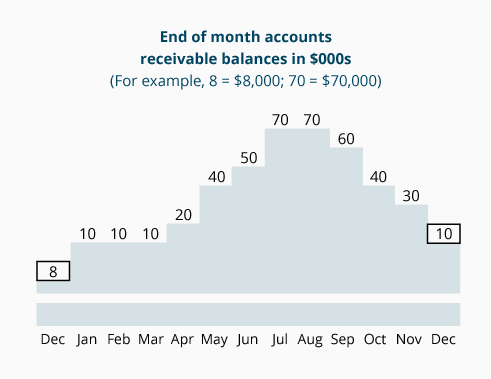
Below is a chart illustrating why using only the final moment at the end of one or two accounting years can lead to a distorted accounts receivable turnover ratio and the related average collection period. In the following example, the company has a seasonal business with a busy season from May through October.

If the average accounts receivable is based on the two end-of-accounting-year balances shown above, the average accounts receivable will be $9,000 (8 + 10 = 18 divided by 2).
However, if the average accounts receivable is based on the beginning balance for January plus the 12 end-of-month balances during the entire accounting year, the average accounts receivable is calculated to be $32,923 (8+10+10+10+20+40+50+70+70+60+40+30+10 = 428 divided by 13).
This shows why a company’s current, detailed accounts receivable records will provide more precision than the summary amounts found in financial statements from an earlier year. Unfortunately, the people outside of a company will not have access to the current, detailed information.
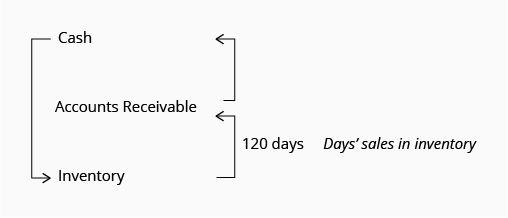
Average collection period
Related to the accounts receivable turnover ratio is the average collection period. As the name indicates this is the average number of days of credit sales that were in accounts receivable during a past year. The average collection period is also known as: days’ sales in accounts receivable, days’ sales in receivables, days’ sales uncollected, days to collect, etc.
When the accounts receivable turnover ratio is known, the average collection period is easy to compute:
Average collection period = 360 or 365 days in a year divided by the accounts receivable turnover ratio
Using the accounts receivable turnover rate of 8 times, the average collection period is:
Average collection period = 360 or 365 days divided by 8 times = 45 days or 45.6 days
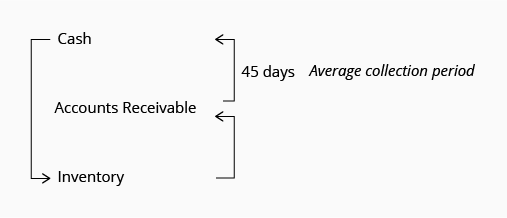
The average collection period of 45 days will be one component of the operating cycle that we presented earlier:

Again, the 45 or 45.6 days is an approximation since the average was based on amounts during the prior year. Keep in mind that some customers may have paid early, some paid near the due date, some paid a week or two weeks late, some paid more than a month late.
Aging of accounts receivable
An aging of accounts receivable is an internal report which sorts a company’s accounts receivable (unpaid sales invoices) according to the date when the customers’ payments are or were due. Amounts that are not yet due will be placed in a column with the heading “Current”. Amounts that should have already been paid are sorted into the appropriate columns with headings such as “1-30 days past due”, “31-60 days past due”, “61-90 days past due” and so on.
Even inexpensive accounting software will allow the smallest of businesses to generate an aging of accounts receivable with a click of a mouse. This allows the authorized people within a company to quickly see the specific customers that are current or are past due in paying the amounts that are owed to the company. The aging of accounts receivable also allows a company to easily monitor customers who attempt to ignore the stated credit terms. Monitoring the accounts receivable is important since a company’s liquidity depends on converting its accounts receivable to cash in time to pay its current liabilities when they are due. As a general rule, you should assume that the longer an account receivable is past due, the less likely that the full amount will be collected.
Cash discounts for early payment
Some companies offer cash discounts to encourage its credit customers to pay the amounts owed within 10 days instead of paying in the required 30 days. These discounts are referred to as early payment discounts or cash discounts. Two common examples of early payment discounts are:
-
1/10, net 30. This means the net amount (the invoice amount minus any authorized returns or allowances) is to be paid in 30 days. However, a 1% cash discount is allowed if the invoice is paid within 10 days. For example, if an invoice is $2,150 and the customer returned $50 of goods, the net amount owed is $2,100. Therefore, if the customer pays the company within 10 days, the customer may deduct 1% of $2,100 and remit only $2,079 ($2,100 minus $21).
-
2/10, net 30. This means that the customer may deduct 2% of the net amount owed, provided the customer remits the payment in 10 days instead of paying in 30 days. Hence, if the net amount is $2,100 it can be satisfied with a remittance of $2,058 ($2,100 minus $42) if it is paid within 10 days.
Unfortunately for the companies offering the early payment discounts, some customers will take the discount but will not remit within the 10-day discount period.
Many companies will not offer early payment discounts because of the high cost. For instance, “2/10, net 30” means a 2% deduction is given for paying 20 days early (the customer must pay in 10 days instead of the required 30 days). Saving (or earning) $42 by paying $2,058 just 20 days sooner is an annualized return of 36% per year.
If the company uses the $2,058 every 20 days and saves $42 each time, the company will earn approximately $756 in a year. This equates to an annual return of 36.7% ($756/$2,058). More simply, multiplying both the 2% and the 20 days by “18” gives you 36% for a 360-day year.
Another way to see the magnitude of the early-payment discount is to assume you had to borrow the needed $2,058 at an annual interest rate of 6%. The amount you will pay in interest will be approximately $7 ($2,058 X 6% per year = $123.48 X 20/360 days). A company will pay interest of only $7 in order to receive the $42 early payment discount.
Requiring new and smaller customers to use a credit card
Some companies realize there is a cost for:
- Investigating whether a potential customer is a good credit risk
- Processing customer remittances
- Following up on unpaid amounts
- Not collecting the amount owed by the customer
When a customer uses a business credit card, the customer will be given 27 to 57 days in which to pay the credit card company. In addition, the customer may receive a 2% cash rebate from the credit card company.
Even though the company selling the goods and services will have to pay a fee of perhaps 3-5% to the credit card processors, the seller gets the following benefits:
- Getting the money deposited in its checking account within a few days of the transaction
- Avoiding the costs already described, and
- Improving the company’s liquidity by avoiding an account receivable.
Working with bankers, asset-based lenders, factors
It is immensely important to have a good business relationship with your banker. This includes frequent communication regarding your business’s financial situation and the actions being taken to have the necessary working capital and liquidity. In the process you will learn how your banker can assist with your company’s financing.
Your banker will inform you whether your company qualifies for a bank line of credit. If your company qualifies for a preapproved line of credit that can be used when needed, you will have less stress by not worrying about daily bank balances and/or having to arrange for a loan when an emergency occurs.
If your banker is unable to provide financing, the banker may advise you where you can turn to for the needed financial assistance. For example, your banker may welcome working with an asset-based lender or a factor who purchases accounts receivable. Both the asset-based lender and the factor may advance cash equal to 85% of a company’s receivables.
Since your banker’s suggestions, advice, and understanding are valuable, establish the communication before your company experiences financial difficulty.
To learn more, visit our Accounts Receivable and Bad Debts Expense Explanation.
Inventory: Turnover (Average and by Item)
Inventory is a necessity for many businesses (retailers, distributors, manufacturers) and it is likely to be their largest current asset. The reason for having a sufficient amount of inventory is to meet customers’ needs. Not having these items in inventory can result in lost sales and perhaps lost customers. On the other hand, having too much inventory can jeopardize the company’s liquidity and may result in some inventory items becoming obsolete. When inventory items become obsolete because of technology or other innovations, the company will experience a loss of profits, equity, working capital, and liquidity.
When a retailer or distributor buys goods to resell (or a manufacturer buys materials to create products), the company moves cash from its checking account (the most liquid asset) to inventory (a not-so-liquid asset). The challenge is to get the inventory items sold so the money gets back into the checking account. (Recall from our earlier diagram that the movement of cash to inventory and then back into the checking account is known as the operating cycle.) During the operating cycle the company will be incurring expenses and also the risk that the inventory will not sell as planned.
For companies that sell goods, inventory is a key component of working capital, but it is not considered to be a “quick asset.” The reason is it can take many months for the goods to be sold or turned over. During this time, the company’s cash will be “sitting” in inventory instead of being available to pay suppliers, employees, bank loans, payroll taxes, etc. In short, having a large amount of inventory will mean a large amount of working capital, but that does not guarantee having the liquidity to pay the bills when they are due.
To assess a company’s ability to convert inventory back into cash during a prior year, two calculations are often made:
- Inventory turnover ratio
- Days’ sales in inventory
Inventory turnover ratio
The inventory turnover ratio indicates how often a company’s inventory “turned over” during a year. Generally, the higher the number of times the inventory is sold or turned over in a year, the better. After all, getting a company’s cash out of inventory and back into the checking account means less risk, less holding costs, more profit, and more liquidity.
Since inventory is reported on a company’s balance sheet at its cost (not at selling prices), the inventory’s cost should be related to the company’s cost of goods sold (not to its sales revenues). Basically, the formula for the inventory turnover ratio = cost of goods sold for a year divided by the average inventory cost during the year.
Unfortunately, the cost of inventory reported on the balance sheet pertains to the final moment of the accounting year, while the cost of goods sold is the cumulative amount for the entire accounting year. Relating the cost of inventory at the final moment of an accounting year to the cost of goods sold throughout the entire accounting year presents a problem. The solution is to find and use the average cost of inventory that is representative of the inventory cost throughout the entire accounting year.
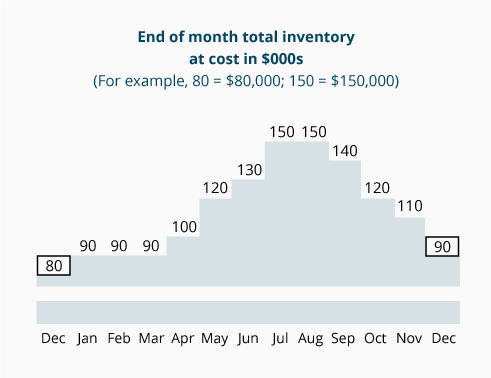
To illustrate why the inventory cost that is reported on the end-of-the-year balance sheet may not be representative of the average inventory amounts throughout the year, we prepared the following chart for a hypothetical company with a seasonal business. As the graph indicates, this company’s inventory levels are highest from May through October. Therefore, It is logical that its accounting year should end on December 31 since this is the lowest point of the business activity.

Average inventory at the beginning and end of the year
When the average inventory for a year is calculated using a company’s annual financial statements, it is likely that the average will be based on the cost of the inventory at the beginning of the year (which is the ending inventory from the previous year) and the cost of the inventory at the end of the most recent year. In our graph we see that the beginning-of-the-year inventory was 80 and the ending inventory was 90. By using only these two moments, the average inventory cost will be calculated to be $85,000 (80 + 90 = 170 divided by 2).
Average inventory using 13 points throughout the year
When the average inventory for the accounting year is calculated using the cost of the inventory at the beginning of the year plus the cost of the inventory at the end of each of the 12 months during the year, the average inventory cost will be $112,308 (80+90+90+90+100+120+130+150+150+140+120+110+90 = 1,460 divided by 13).
How the average inventory affects the inventory turnover ratio
Now let’s see how the two calculations of the average inventory cost will affect the inventory turnover ratio. For these calculations we will assume that the cost of goods sold for the entire accounting year was $360,000.
Inventory turnover ratio based on average inventory of two points = Cost of goods sold for the year divided by the average inventory cost throughout the year = $360,000 divided by $85,000 = 4.2 times
Inventory turnover ratio based on average inventory of 13 points = Cost of goods sold for the year divided by the average inventory cost throughout the year = $360,000 divided by $112,308 = 3.2 times
Since the average inventory of $85,000 (from using only the two end-of-the-year amounts) was not representative of the actual inventory amounts throughout the year, the resulting inventory turnover ratio of 4.2 times is not a good indicator of the number of times that the inventory had turned over during the year.
Since the average inventory of $112,308 (from using 13 points throughout the year) was more representative of the actual inventory amounts during the year, the resulting inventory turnover ratio of 3.2 times is a better indicator.
Other precautions when using the inventory turnover ratio
The calculations of average inventory cost also bring to mind some important comments that are pertinent for all financial ratios:
-
Ratios are most relevant when they are used to reveal a financial ratio trend within one’s own company. When used within one’s own company, the financial ratio calculations will be consistent.
-
Ratios could be relevant when comparing companies that are within the same industry.
-
The financial ratios of a company in one industry will not be comparable to the financial ratios of a company in a different industry. There could be several reasons: types of products, business structure, manufacturer versus service provider, credit terms, etc.
Now let’s do one more calculation of the inventory turnover ratio by using some new information. Let’s assume that a company’s income statement for a recent year reported the cost of goods sold of $720,000. It was also determined that the average cost of inventory throughout the year was $240,000.
Using these amounts, the inventory turnover ratio is calculated as follows:
Inventory turnover ratio = Cost of goods sold for a year divided by the average cost of inventory throughout the year = $720,000 divided by $240,000 = 3 times
This calculation shows that the company’s inventory “turned over” on average 3 times during the year. However, this is an average consisting of some products which may have turned over 10 times during the year, some products turning over two times during the year, and some products for which no sales occurred during the entire year.
Days’ sales in inventory
Related to the inventory turnover ratio is the day’s sales in inventory, which is the average number of days it took to sell the average amount of inventory held by a company during a prior year. In other words, it indicates the number of days (on average) it took for the inventory to turn over during the year.
The days’ sales in inventory is easy to calculate when the inventory turnover ratio is known. It is the number of days in a year divided by the inventory turnover ratio. While there are usually 365 days in a year, often 360 days are used to calculate financial metrics. Assuming that the inventory turnover was 3 times, the days’ sales in inventory will be:
Days’ sales in inventory = 360 or 365 days in a year divided by the inventory turnover ratio of 3 times = 120 or 121.7 days
Recall that the days’ sales in inventory was one of the two components of a company’s operating cycle.

The 120 or 121.7 days of sales in inventory is an approximate average time needed to sell the average amount of inventory during the past year. Some products may have sold quickly because of high demand and some products may have been sitting without any units being sold during the year.
Since the days’ sales in inventory is related to the inventory turnover ratio, the days’ sales in inventory will also have the concerns mentioned in our discussion of the inventory turnover ratio:
- How the average inventory is calculated will affect the inventory turnover ratio
- Ratios are most reliable when used within one’s own company over time
- Ratios could be relevant if used to compare companies within the same industry
- The financial ratios of a company in one industry are not likely comparable to the financial ratios of a company in a different industry. The reasons could be numerous: types of products, business structure, manufacturer versus service provider, credit terms, etc.
- Last year’s demand for the company’s products may not be indicative of the current or future demand
Inventory turnover ratio and days’ sales for each item in inventory
So far, our inventory calculations were based on a company’s total inventory. Since people within a company have more detailed information, the concepts we used for the total inventory can also be applied to each and every item in inventory. For example, with a computer system it is relatively easy to show the inventory turnover and the days’ sales in inventory for every one of the products in inventory. This will provide company personnel with more helpful information for managing inventory.
For example, an internal report that lists the quantities of each inventory item could be expanded to show:
- Number of units on hand
- Number of units sold in the past year
- Annual turnover ratio
- Days’ sales in inventory
Highlighting the items that have more than 120 days’ sales in inventory may lead to action that will help the company. Perhaps some items haven’t been sold in the past year and should be sold at a clearance price or scrapped to save the costs of holding. Perhaps the method of calculating the future quantities to be purchased or produced should be improved.
To learn more, visit our Inventory and Cost of Goods Sold Explanation.
Accounts Payable
Accounts Payable is a current liability account that is credited when a company has received goods and/or services on credit terms. (The debit often involves an expense or asset account.) One practice is to credit Accounts Payable only after a three-way match has taken place. This means that the vendor’s invoice, the company’s purchase order, and the company’s receiving report are reviewed and are in agreement. When the company pays a previously recorded amount, Accounts Payable will be debited and Cash will be credited.
If a company has incurred an expense and/or a liability, but the vendor’s invoice has not yet been recorded in Accounts Payable as of the end of an accounting period, it will have to be recorded through an adjusting entry which will likely credit a current liability account such as Accrued Liabilities, Accrued Expenses, or Accrued Expenses Payable.
It is beneficial for a company’s cash balance and liquidity to seek credit terms (or trade credit) from the vendors that provide goods and services. It is also helpful for the company to use a business credit card. (This will be discussed in the next section.)
Increasing accounts payable or accrued liabilities instead of paying cash will not change the amount of the company’s working capital. However, the company will have more cash on hand because of the delay in paying out cash. The higher cash balance will result in additional liquidity at least temporarily. The current ratio will change slightly depending on the amount of the current assets and the current liabilities.
Business Credit Card
A business credit card is a convenient way for a company to pay some of its obligations without immediately reducing the company’s cash. Assuming that a company has a business credit card and that a vendor accepts it as payment, the company will gain 27 to 57 days before having to pay the credit card company. In the meantime, the vendor receives its money (minus a 3-5% fee) from the credit card company within a few days of the transaction. It is also possible that the company paying with the business credit card will receive a cash rebate of 2% from the credit card company.
The business credit card transactions which are not yet paid must be reported as an accrued liability. Therefore, the use of a business credit card will not give the company any additional working capital, but the company will have some additional liquidity from holding its cash for the 27 to 57 days until the credit card statement becomes due.
To learn more, visit our Accounts Payable Explanation.
Statement of Cash Flows
Since the accrual method of accounting is the general rule for financial statements that are distributed to people outside of the company, a company’s income statement will be reporting the revenues earned (not its cash receipts) and the expenses that occurred (not the cash it paid out). Since some users of the financial statements need cash flows for a variety of financial models and analyses, the accounting standards require that a statement of cash flows (SCF, or cash flow statement) accompany a company’s balance sheet, income statement, and the other financial statements distributed outside the company.
The SCF identifies the major cash inflows and cash outflows that occurred during the accounting period of the income statement. The cash inflows and outflows also reconcile the change in the amount of cash and cash equivalents from the beginning of the year to the end of the year. Seeing the sources and uses of cash for a recent time period may provide insights regarding the company’s liquidity.
The SCF organizes a company’s main cash flows into three major sections:
-
Cash flows from operating activities which typically begins with net income and then adjusts for the changes in the balances of the working capital accounts (except for short-term loans which are included as part of financing activities). There are also adjustments for noncash income statement items such as depreciation and amortization expenses as well as gains and losses on the sale of long-term assets.
-
Cash flows from investing activities which includes the purchase and/or sale of long-term assets
-
Cash flows from financing activities which includes borrowing and repaying of short-term and/or long-term debt, issuing or reacquiring capital stock, and payment of dividends
In the three major sections of the SCF:
-
Cash inflows appear as positive amounts to indicate that they have a positive or favorable effect on the company’s cash balance. For example, if a company sells additional common stock, the amount received will be shown as a positive amount in the section cash flows from financing activities.
-
Cash outflows are shown in parentheses to indicate they have a negative or unfavorable effect on the company’s cash balance. For instance, if a company purchases new equipment, the amount spent will be shown in parentheses in the section cash flows from investing activities.
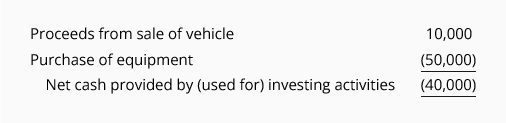
-
The cash inflows and the cash outflows in each section of the SCF will be summed and the resulting net amount for each section is shown. For example, if a company sold one of its delivery vehicles for $10,000 and it purchased equipment for $50,000, the section cash flows from investing activities will show:

Cash flows from operating activities
The first section of the statement of cash flows (SCF) will likely have a heading similar to one of the following:
- Cash Flows from Operating Activities
- Operating Activities
- Cash Provided by Operations
The total or net amount of the first section of the SCF is often described as:
- Net cash provided by operating activities
- Cash provided by operations
In the U.S., the FASB allows for this first section of the SCF to be presented in one of two ways: the direct method or the indirect method. Even though the FASB prefers the direct method, nearly all corporations have chosen to use the indirect method. Therefore, our discussion is limited to the indirect method.
Under the indirect method, the section cash flows from operating activities (CFOA) begins with the amount of the net income that was reported on the company’s income statement. Since the net income was determined using the accrual method of accounting, there will be some revenues, expenses, gains, and losses reported on the income statement that did not involve cash during the accounting period. Two examples are depreciation and amortization expenses. Therefore, those amounts will be shown as an adjustment to the net income.
Next, the CFOA will list the adjustments to the working capital accounts (other than short-term loans which will be reported in the financing activities section). These adjustments are necessary to convert the accrual method amounts on the income statement to become the cash method amounts. Basically, the amount of the adjustments will be the change in the working capital accounts such as the following:
- Accounts receivable
- Inventory
- Prepaid expense
- Other current assets
- Accounts payable and accrued expenses
- Income taxes payable
Here are some of the common items appearing in the cash flows from operating activities (CFOA) section along with hypothetical amounts:
-
Assuming the income statement reported net income of $59,000, the CFOA will begin with 59,000 as a positive amount. [A net loss would be shown in parentheses.]
-
If the income statement included depreciation expense of $13,000, the CFOA will report 13,000 as a positive amount. The amount of the depreciation must be added back to the amount of the net income because the depreciation entry reduced net income, but cash was not used.
-
If accounts receivable increased by $12,000, CFOA will report (12,000) because it was not good (it was unfavorable) for the company’s liquidity to have accounts receivable increase instead of receiving cash at the time of the sale. [Had there been a decrease in receivables there would have been a positive adjustment. The reason is that converting more receivables to cash would have been good or favorable for the company’s liquidity.]
-
If inventory decreased by $3,000, CFOA will report 3,000. It is a positive amount since converting inventory into cash during the accounting period was good for the company’s cash balance and the company’s liquidity.
-
If accounts payable increased by $7,000, CFOA will report 7,000. It is a positive amount since it was favorable for the company’s cash balance and liquidity to delay paying some bills. [A decrease in payables would require a negative adjustment.]
The above items will appear in the CFOA section as follows:

Note:
In the section entitled cash flows from operating activities the positive amounts indicate that more cash was received than indicated by the company’s net income shown on the income statement. Negative amounts indicate that less cash was received than the net income reported on the income statement.
You can also think of the positive amounts as being positive, good, or favorable for a company’s liquidity. Negative amounts can be thought of as not good or unfavorable for a company’s liquidity.
Knowing more about the cash that a company has been generating from its business operations (operating activities) is important for learning more about a company’s liquidity.
You will find that U.S. corporations with common stock that is publicly traded will cite amounts from the CFOA section of the SCF when discussing the corporation’s liquidity in their Annual Report to the Securities and Exchange Commission (Form 10-K).
Operating cash flow ratio
A financial ratio that uses a statement of cash flows (SCF) amount to indicate the adequacy of a company’s working capital and liquidity is the operating cash flow ratio, which is computed as follows:
Operating cash flow ratio = net cash provided by operating activities divided by the average amount of current liabilities.
If the net cash provided by operating activities is taken from the SCF of a recent year, it should be divided by the average amount of current liabilities throughout the same year. (Using only the amount of current liabilities at the final moment of an accounting year may be misleading.)
To illustrate the calculation of the operating cash flow ratio, let’s assume that a company’s SCF for the prior year reported net cash provided by operating activities of $200,000. For the same year it was determined that the average amount of current liabilities during the year was $300,000. Inserting those amounts into the formula, we have:
Operating cash flow ratio = net cash provided by operating activities divided by average current liabilities = $200,000 divided by $300,000 = 67%, or 0.67:1, or 0.67 to 1
To learn more, visit our Cash Flow Statement Explanation.
Reasons Why Liquidity Will Decrease
Below are some reasons why a company’s liquidity can decrease. They are organized according to the format of the statement of cash flows.
Operating activities
Net loss from the business operations
Accounts receivable increased
Inventory increased
Prepaid expenses increased
Accounts payable decreased
Investing activities
Capital expenditures (purchase of equipment, etc.)
Purchase of long-term investments
Financing activities
Repayment of short-term and long-term debt
Declaring dividends for stockholders
Purchase of treasury stock
Sole proprietor’s or partners’ draws
Since the above items will have an unfavorable or negative effect on a company’s liquidity, the respective amounts will appear on the SCF in parentheses.
Reasons Why Liquidity Will Increase
Below are some reasons associated with an increase in a company’s cash and liquidity. The reasons are arranged according to the format of the statement of cash flows.
Operating activities
Net income from the business operations
Accounts receivable decreased
Inventory decreased
Prepaid expenses decreased
Accounts payable increased
Investing activities
Proceeds from the sale of assets used in the business
Proceeds from the sale of long-term investments
Financing activities
Short-term and long-term borrowings
Proceeds from issuing shares of common and preferred stock
Proceeds from sale of treasury stock
Since the above items will have a favorable or positive effect on a company’s liquidity, their amounts will appear on the statement of cash flows as positive amounts.
Where to Go From Here
We recommend taking our Practice Quiz next, and then continuing with the rest of our Working Capital and Liquidity materials (see the full outline below).
We also recommend joining PRO to unlock our premium materials (certificates of achievement, video training, flashcards, visual tutorials, quick tests, quick tests with coaching, cheat sheets, guides, puzzles, business forms, printable PDF files, progress tracking, badges, points, medal rankings, activity streaks, public profile pages, and more).
Disclaimer
You should consider our materials to be an introduction to selected accounting and bookkeeping topics (with complexities likely omitted). We focus on financial statement reporting and do not discuss how that differs from income tax reporting. Therefore, you should always consult with accounting and tax professionals for assistance with your specific circumstances.

Earn Our Certificate
for This Topic
When you join PRO, you will receive instant access to 16 different Certificates of Achievement plus our Bookkeeping Certificate of Excellence.
View PRO Features