Introduction
If you received $100 today and deposited it into a savings account, it would grow over time to be worth more than $100. This fact of financial life is a result of the time value of money, a concept which says it’s more valuable to receive $100 now rather than a year from now. To put it another way, the present value of receiving $100 one year from now is less than $100.
Accountants use Present Value (PV) calculations to account for the time value of money in a number of different applications. For example, assume your company provides a service in December 2025 and agrees to be paid $100 in December 2026. The time value of money tells us that part of the $100 is interest you will earn for waiting one year for the $100. Perhaps only $91 of the $100 is service revenue earned in 2025 and $9 is interest that will be earned in 2026. The calculation of present value will remove the interest, so that the amount of the service revenue can be determined. Another example might involve the purchase of land: the owners will either sell it to you for $160,000 today, or for $200,000 if you pay at the end of two years. To help analyze the alternatives, you would use a PV calculation to tell you the interest rate implicit in the second option.
PV calculations can also tell you such things as how much money to invest right now in return for specific cash amounts to be received in the future, or how to estimate the rate of return on your investments. Our focus will be on single amounts that are received or paid in the future. We’ll discuss PV calculations that solve for the present value, the implicit interest rate, and/or the length of time between the present and future amounts.
WATCH NOW
Advance Your Career with Our PRO Training
Calculations for the Present Value of a Single Amount
At the outset, it’s important for you to understand that PV calculations involve cash amounts—not accrual amounts.
In present value calculations, future cash amounts are discounted back to the present time. (Discounting means removing the interest that is imbedded in the future cash amounts.) As a result, present value calculations are often referred to as a discounted cash flow technique.
PV calculations involve the compounding of interest. This means that any interest earned is reinvested and will earn interest at the same rate as the principal. In other words, you “earn interest on interest.” The compounding of interest can be very significant when the interest rate and/or the number of years is sizeable.
We will use present value (PV) to mean the present value of a single future amount such as one receipt or one payment. Here are the components of a present value (PV) calculation:
- Present value amount (PV)
- Future value amount (FV)
- Length of time before the future value amount occurs (n)
- Interest rate used for discounting the future value amount (i)
If you know any three of these four components, you will be able to calculate the unknown component. Accountants are often called upon to calculate this unknown component.
Visualizing the Present Value (PV) Amount
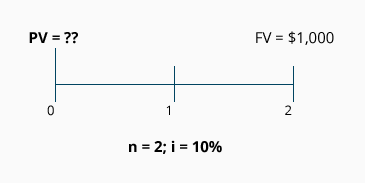
Let’s assume that Customer X provides your company with a promissory note for $1,000 in exchange for service your company provided. The note is due at the end of two years and it does not specify any interest. The fair market value of the note and the fair market value of the service are not known. Because of the time value of money, you know that some interest is involved in a two-year note, even though it is not stated explicitly. You estimate the interest rate by considering both the length of the loan and the credit worthiness of Customer X. If Customer X is a reputable company like Google, you know there is minimal risk and a low interest rate would be used. If, however, Customer X has a bad credit history, then a high interest rate would be used. Let’s assume that you have determined 10% to be the appropriate rate for Customer X. We now know three of the four components we need: (1) the future value amount ($1,000), (2) the length of time (2 years), and (3) the interest rate (10%). With these three components, we know enough to calculate the fourth component, present value.
A timeline can help us visualize what is known and what needs to be computed. The present time is noted with a “0,” the end of the first period is noted with a “1,” and the end of the second period is noted with a “2.”
The following timeline depicts the information we know, along with the unknown component, (PV):

The letter “n” refers to the length of time (in this case, two years). The letter “i” refers to the percentage interest rate used to discount the future amount (in this case, 10%). Both (n) and (i) are stated within the context of time (e.g., two years at a 10% annual interest rate).
(Later on we will give examples where (n) and (i) pertain to a half-year, a quarter of a year, or a month.)
Visualizing The Length of Time (n)
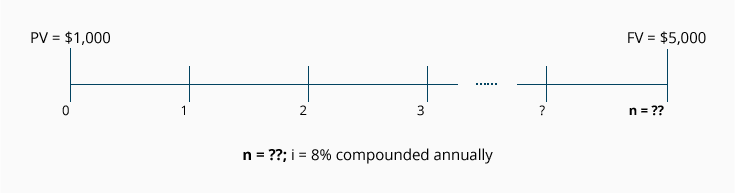
Sometimes the present value, the future value, and the interest rate for discounting are known, but the length of time before the future value occurs is unknown. To illustrate, let’s assume that $1,000 will be invested today at an annual interest rate of 8% compounded annually. The investment will be sold when its future value reaches $5,000. Because we know three components, we can solve for the unknown fourth component—the number of years it will take for $1,000 of present value to reach the future value of $5,000.
The following timeline depicts the known components and the unknown component (n):

Visualizing The Interest Rate (i)
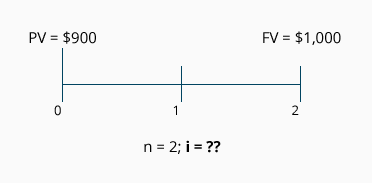
What will our timeline look like when our unknown component is the interest rate? For this example, let’s assume that we know the following: the present value is $900, the future value amount is $1,000, and the length of time before the future value occurs is two years. Since we know three of the components, the fourth one—the interest rate that will discount the future value amount to the present value—can be calculated.
The following timeline depicts the known components and the unknown component (i):

Visualizing The Future Value Amount (FV)
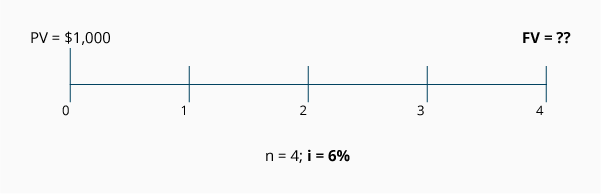
Let’s assume that the interest rate, the length of time, and the present value are known, and the future value is the component we don’t know. If a present value of $1,000 is invested at 6% per year and compounded annually for four years, what is the future value amount?
The following timeline depicts the known components and the unknown component (FV):

As illustrated in the four timelines above, there is a logical connection between present value and future value. (Visit our Future Value of a Single Amount Explanation.)
Frequency of Compounding
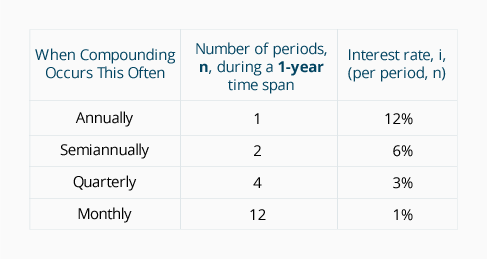
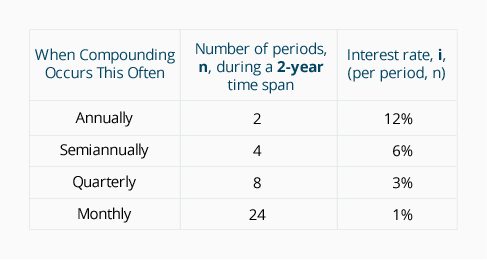
In the illustrations of the present value of 1 (shown earlier) we assumed that interest was compounded on an annual basis. Now we’ll look at what happens when interest is compounded (1) annually, (2) semiannually, (3) quarterly, and (4) monthly.
The tables below show the number of periods (n) and the related interest rate (i) for four different compounding assumptions.
The following table reflects a single amount invested for one year and earning an annual interest rate of 12%:

The following table reflects a single amount invested for two years and earning an annual interest rate of 12%:
To demonstrate the variations that occur with different compounding assumptions, let’s look at an example: Assume that on January 1, 2024, a single deposit of $10,000 was made into each of four accounts. Although each of the four accounts earns an annual interest rate of 12%, the interest is compounded differently. We’ll track the account activity for two years.
- Compounded annually
Since our first account is compounded annually, it receives two interest deposits—one at the end of each year; we refer to this as n = 2. The annual interest rate is 12%; we refer to this as i = 12% per year.Here’s how the account activity will occur:
At the end of 2024, $1,200 of interest had been earned on the balance of $10,000; this interest was automatically reinvested and added to the balance. In 2025, $1,344 of interest was earned on a balance of $11,200 ($1,200 on the principal of $10,000 plus $144 on the $1,200 of interest earned in 2024.)
- Compounded semiannually
Our second account is compounded semiannually and receives four interest deposits—one at the end of each six-month period. If we view the annual interest rate of 12% as a semiannual interest rate of 6%, it means that the two-year investment will have n = 4 semiannual interest deposits, and i = 6% per half-year. Here’s how the account activity will occur:
- Compounded quarterly
Our third account is compounded quarterly and receives eight interest deposits—one at the end of each three-month period. If we view the annual interest rate of 12% as a quarterly interest rate of 3%, it means that the two-year investment will have n = 8 quarterly interest deposits, and i = 3% per quarter. Here’s how the account activity will occur:
- Compounded Monthly
Our fourth account is compounded monthly and receives 24 interest deposits—one at the end of every month. If we view the annual interest rate of 12% as a monthly interest rate of 1%, it means that the two-year investment will have n = 24 monthly interest deposits, and i = 1% per month. Here’s how the account activity will occur:
The next two tables compare selected account balances from each of the four accounts above:


As you have seen, the frequency of compounding requires you to adjust the number of periods (n). Likewise, the interest rate (i) must be adjusted to be compatible with (n).
Compounding affects both present value and future value. In Table 2 we see that on December 31, 2025, Account #4—the account that is compounded monthly—has the highest future value: $12,697.35. When interest is deposited monthly, the account earns “interest on interest” more often. In the last column we see a present value factor of 0.78757—this tells us the amount we need in the present time to grow to 1.000 in the future. In other words, because of monthly compounding, we need only deposit $0.78757 today for it to grow to be $1.00 at the end of two years (with a 12% annual interest rate). With less compounding (e.g., annual, semiannual, or quarterly) we need to deposit more today in order for the amount to grow to $1.00 during the same span of time as monthly compounding.
PV calculations greatly assist investment decisions because of their ability to bring future amounts into the context of the present (to time period 0). After all, it is hard to relate $100,000 being spent today (a present value) to $300,000 that is expected to be received 20 years from today (a future value). By discounting that future $300,000 to a present value, we can more logically compare it to the $100,000 because both amounts will be expressed in present value amounts.
Handling More Than One Future Amount
If there are two or more future amounts occurring at different times for an investment, their present value can be determined by simply discounting each amount separately. For example, if an amount of $5,000 occurs at the end of two years, and a second amount of $6,000 occurs at the end of five years, you simply calculate the present value of each and combine them.
If the future amounts are identical in amount and they occur at equal time intervals, the situation is referred to as an annuity. (Visit our Present Value of an Ordinary Annuity Explanation.)
Present Value Formulas, Tables and Calculators
The easiest and most accurate way to calculate the present value of any future amounts (single amount, varying amounts, annuities) is to use an electronic financial calculator or computer software. Some electronic financial calculators are now available for less than $35.
IMPORTANT! Understand that each financial calculator operates differently and may operate in a manner that is different from our Explanation. Be certain to read and thoroughly understand the directions before operating any calculator or computer software. One incorrect assumption, one incorrect input, or the use of a button that works differently from what you assumed, will mean an incorrect answer—and that could have a significant financial consequence!
If you don’t have access to an electronic financial calculator or software, an easy way to calculate present value amounts is to use present value tables (PV tables). PV tables cannot provide the same level of accuracy as financial calculators or computer software because the factors used in the tables are rounded off to fewer decimal places. In addition, they usually contain a limited number of choices for interest rates and time periods. Despite this, present value tables remain popular in academic settings because they are easy to incorporate into a textbook. Because of their widespread use, we will use present value tables for solving our examples.
Behind every table, calculator, and piece of software, are the mathematical formulas needed to compute present value amounts, interest rates, the number of periods, and the future value amounts. We will, at the outset, show you several examples of how to use the present value formula in addition to using the PV tables.
Except for minor differences due to rounding, answers to equations below will be the same whether they are computed using a financial calculator, computer software, PV tables, or the formulas.
Calculating the Present Value of a Single Amount (PV)
In this section we will demonstrate how to find the present value of a single future cash amount, such as a receipt or a payment. We’ll refer to the present value of a single amount as PV.
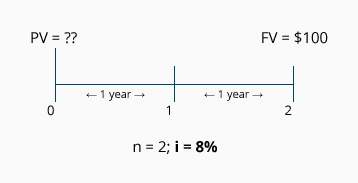
Exercise #1
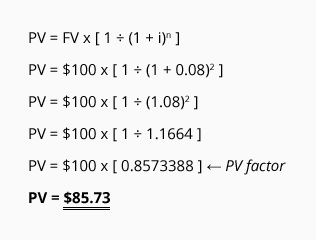
Let’s assume we are to receive $100 at the end of two years. How do we calculate the present value of the amount, assuming the interest rate is 8% per year compounded annually?
The following timeline depicts the information we know, along with the unknown component (PV):

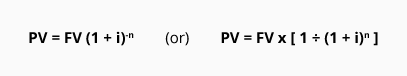
Calculation Using the PV Formula
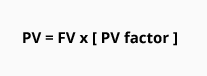
The present value formula for a single amount is:

Using the second version of the formula, the solution is:

The answer, $85.73, tells us that receiving $100 in two years is the same as receiving $85.73 today, if the time value of money is 8% per year compounded annually. (“Today” is the same concept as “time period 0.”)
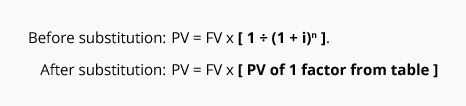
Calculation Using a PV of 1 Table
It’s common for accounting and finance textbooks to provide present value tables to use in calculating present value amounts. In a PV of 1 table, each column heading displays an interest rate (i), and the row indicates the number of periods into the future before an amount will occur (n). At the intersection of each column and row is the correlating present value of 1 (PV of 1) factor. The PV of 1 factor tells us what the present value will be, at time period 0, for a single amount of $1 at the end of time period (n). Click the following to see a present value of 1 table: PV of 1 Table.
The PV of 1 table has two limitations: (1) values are rounded (ours has the rounding to three decimal places for ease of use) and thus the table sacrifices a bit of accuracy, and (2) the table displays only a limited number of choices for rates and years.
Once you determine the PV of 1 factor from the table, simply use it to substitute for the following term in the PV formula: [ 1 ÷ (1 + i)n ]

Using the data presented in Exercise #1, we can solve for the present value of receiving $100 at the end of two years, when discounted by an interest rate of 8% compounded annually:

Because the PV of 1 table had the factors rounded to three decimal places, the answer ($85.70) differs slightly from the amount calculated using the PV formula ($85.73). In either case, what the answer tells us is that $100 at the end of two years is the equivalent of receiving approximately $85.70 today (at time period 0) if the time value of money is 8% per year compounded annually.
Exercise #2
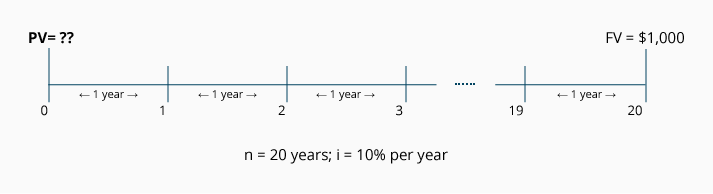
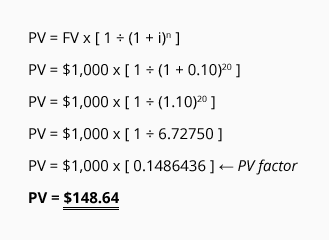
We need to calculate the present value (the value at time period 0) of receiving a single amount of $1,000 in 20 years. The interest rate for discounting the future amount is estimated at 10% per year compounded annually.
The following timeline depicts the information we know, along with the unknown component (PV):

Calculation Using the PV of 1 Formula
Using the formula to determine the present value, we have:

The answer tells us that receiving $1,000 in 20 years is the equivalent of receiving $148.64 today, if the time value of money is 10% per year compounded annually.
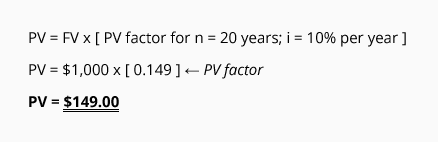
Calculation Using a PV of 1 Table
Use the PV of 1 table to find the (rounded) present value factor at the intersection of n = 20 and i = 10%. To calculate the present value of receiving $1,000 at the end of 20 years with a 10% interest rate, insert the factor into the formula:

We see that the present value of receiving $1,000 in 20 years is the equivalent of receiving approximately $149.00 today, if the time value of money is 10% per year compounded annually.
Exercise #3
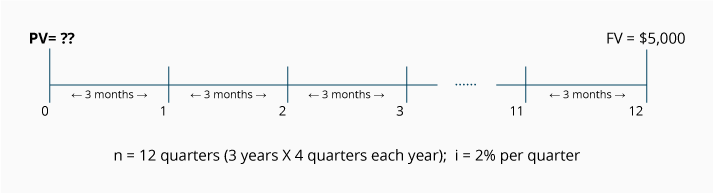
What is the present value of receiving a single amount of $5,000 at the end of three years, if the time value of money is 8% per year, compounded quarterly?
The following timeline depicts the information we know, along with the unknown component (PV):
Notice that the timeline shows n = 12, because there are 12 quarters in the three-year period. Because the time periods are three months long, the rate for discounting is i = 2% (the quarterly rate that results from the annual rate of 8% divided by the four quarters in each year).
Calculation Using the PV Formula
Using the formula to determine the present value, we have:

The answer tells us that receiving $5,000 three years from today is the equivalent of receiving $3,942.45 today, if the time value of money has an annual rate of 8% that is compounded quarterly.
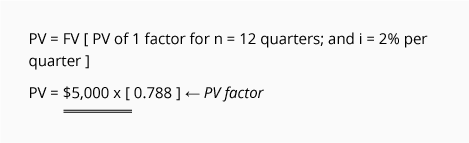
Calculation Using a PV of 1 Table
The present value of receiving $5,000 at the end of three years when the interest rate is compounded quarterly, requires that (n) and (i) be stated in quarters. Use the PV of 1 Table to find the (rounded) present value figure at the intersection of n = 12 (3 years x 4 quarters) and i = 2% (8% per year ÷ 4 quarters). Insert the factor into the formula:

We see that the present value of receiving $5,000 three years from today is approximately $3,940.00 if the time value of money is 8% per year, compounded quarterly.
Exercise #4
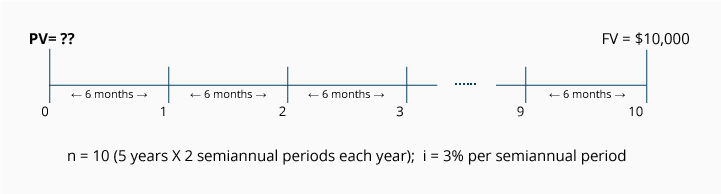
What is the present value of receiving a single amount of $10,000 at the end of five years, if the time value of money is 6% per year, compounded semiannually?
The following timeline depicts the information we know, along with the unknown component (PV):

Notice that the timeline shows n = 10, because there are 10 six-month (or semiannual) periods in five-years time. Because the compounding occurs semiannually, the rate for discounting is i = 3% per six-month period (the annual rate of 6% divided by the two semiannual periods in each year).
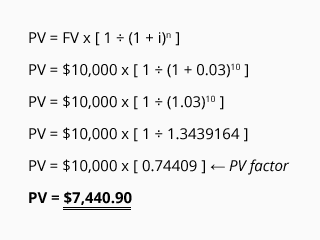
Calculation Using the PV Formula
Using the formula to determine the present value, we have:

The answer tells us that receiving $10,000 five years from today is the equivalent of receiving $7,440.90 today, if the time value of money has an annual rate of 6% compounded semiannually.
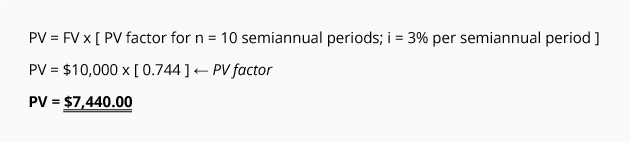
Calculation Using a PV of 1 Table
The present value of receiving $10,000 at the end of five years when the compounding is semiannual, requires that n = 10 (5 years X 2 semiannual periods per year) and that i = 3% (6% per year ÷ two semiannual periods in each year). Use the PV of 1 Table to find the (rounded) present value factor at the intersection of n = 10 and i = 3%. Insert the factor into the formula:

We see that the present value of receiving $10,000 five years from today is the equivalent of receiving approximately $7,440.00 today, if the time value of money has an annual rate of 6% compounded semiannually.
Calculating the Length of Time (n)
There are occasions when we need to determine the length of time (n) in a Present Value (PV) calculation. To do this, we need to know the three other components in the PV calculation: present value amount, future cash amount (FV), and the interest rate used for discounting the future cash amount (i).
Exercise #5
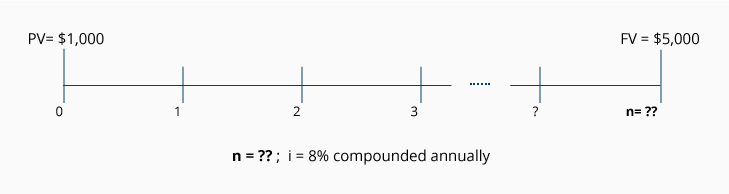
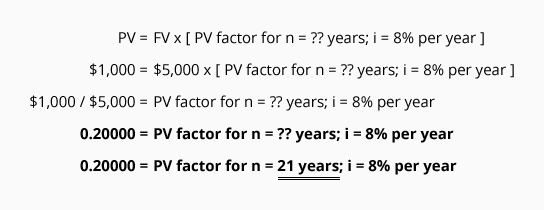
What is the length of time involved if a future amount of $5,000 has a present value of $1,000, and the time value of money is 8% compounded annually?
The following timeline depicts the information we know, along with the unknown component (n):

Calculation Using the Present Value of 1 Table
As we had done earlier, we start with the PV formula: PV = FV x [ 1 ÷ (1 + i)n ]. We then substitute the PV of 1 factor for the expression “[ 1 ÷ (1 + i)n ]”. Our equation now reads:

From the information we’ve been given, we know that the future value is $5,000, the present value is $1,000, and the annual interest rate is 8% compounded annually. Let’s plug those numbers into our equation to solve for (n), the number of annual time periods:

Our equation tells us that the PV of 1 factor is 0.20000. Since the rate for discounting is 8% compounded annually, we look at the PV of 1 Table in the 8% column and find the amount closest to 0.200; this would be 0.199. We see it is located in the row where n = 21. This tells us that the missing component, length of time, is approximately 21 years.
Exercise #6
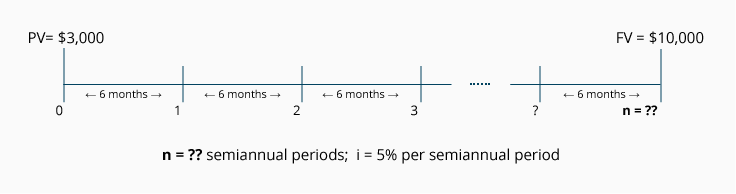
What is the length of time involved if a future amount of $10,000 has a present value of $3,000, and the time value of money is 10% per year compounded semiannually?
The following timeline depicts the information we know, along with the unknown component (n):

Calculation Using a PV of 1 Table
As mentioned previously, if you are furnished with a table containing present value factors, the formula PV of 1 = FV times [ 1 ÷ (1 + i)n ], can be restated to:
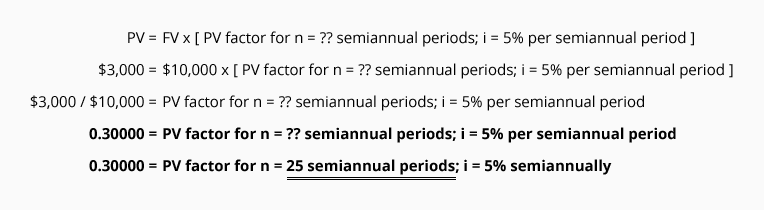
From the information we’ve been given, we know that the future value is $10,000 and the present value is $3,000. The annual interest rate is 10% compounded semiannually, which we can restate as 5% per semiannual period. When we plug in the information we know, we can solve for (n), the number of semiannual periods:

Our equation tells us that the PV factor is 0.30000. Since the rate for discounting is 5% per semiannual period, we look at the PV of 1 Table in the 5% column and find the amount closest to 0.300; this would be 0.295. We see it is located in the row where n = 25. This tells us that the missing component, length of time, is approximately 25 semiannual periods (about 12.5 years).
Exercise #7
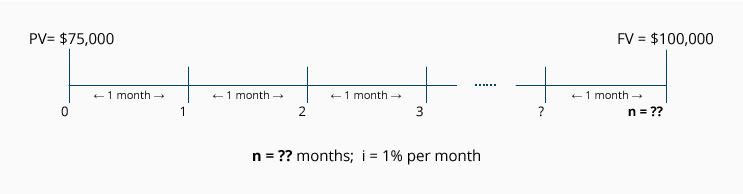
What is the length of time involved if a future amount of $100,000 has a present value of $75,000, and the time value of money is 12% per year compounded monthly?
The following timeline depicts the information we know, along with the unknown component (n):

Calculation Using a PV of 1 Table
From the information we’ve been given, we know that the future value is $100,000 and the present value is $75,000. The annual interest rate is 12% compounded monthly, which we can restate as 1% per month. Let’s plug in the information we know and solve for (n):

Our equation tells us that the PV factor is 0.750. Since the rate for discounting is 1% per month, we look at the PV of 1 Table in the 1% column and find the amount closest to 0.750; this amount would be 0.749. We see it is located in the row where n = 29. This tells us that the missing component, length of time, is approximately 29 months (about 2.4 years).
Calculating the Interest Rate (i)
Now we will show how to find the interest rate (i) for discounting the future amount in a present value (PV) calculation. To do this, we need to know the three other components in the PV calculation: present value amount (PV), future amount (FV), and the length of time before the future amount is received (n).
Exercise #8
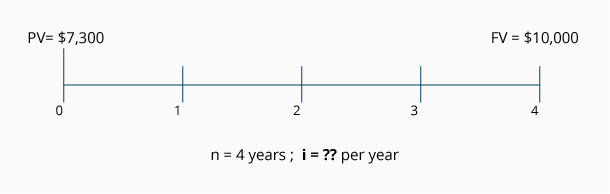
What is the annual interest rate necessary to discount a future amount of $10,000 to a present value of $7,300 over a four-year period, assuming the interest is compounded annually?
The following timeline depicts the information we know, along with the unknown component (i):

Calculation Using a Present Value of 1 Table
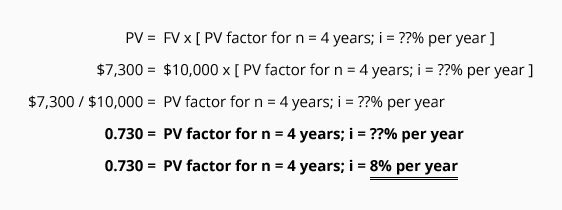
As the timeline indicates, we know the future value is $10,000 and the present value is $7,300. The number of years (n) is four. The unknown component is the annual interest rate (i), which is compounded annually. In equation form, Exercise #8 looks like this:

Our equation tells us that the PV factor is 0.730. Since the number of periods is four, we look at the PV of 1 Table in the row where n = 4 and find the amount closest to 0.730; this would be 0.735. We see it is located in the column where i = 8%. This tells us that the missing component, the annual interest rate, is approximately 8% compounded annually.
Exercise #9
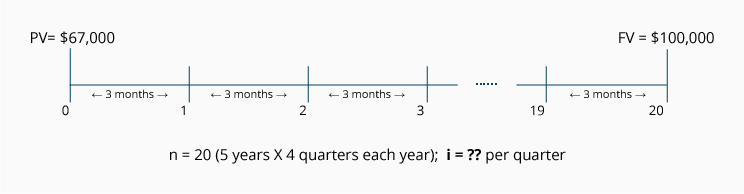
What is the annual interest rate necessary to discount a future amount of $100,000 to a present value of $67,000 over a five-year period, assuming the interest is compounded quarterly?
The following timeline depicts the information we know, along with the unknown component (i):
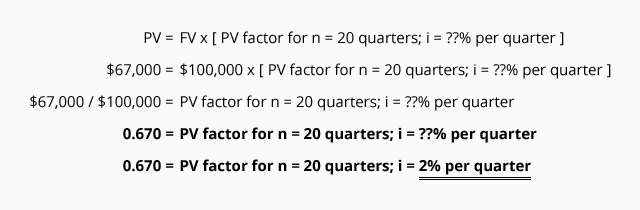
Calculation Using a PV of 1 Table
As the timeline indicates, we know the future value is $100,000 and the present value is $67,000. The number of periods (n) is 20 quarters (5 years x 4 quarters per year). The unknown component is the interest rate (i), which will be expressed as a quarterly rate. In equation form, Exercise #9 looks like this:

Our equation tells us that the PV factor is 0.670. Since the number of periods is 20 quarters, we look at the PV of 1 Table in the row where n = 20 and we find the amount closest to 0.670; this would be 0.673. We see it is located in the column where i = 2%. This tells us that the missing component, the interest rate is approximately 2% per quarter. However, the exercise asked for the annual interest rate, compounded quarterly. The annual interest rate is approximately 8% (the quarterly interest rate x four quarters).
Exercise #10
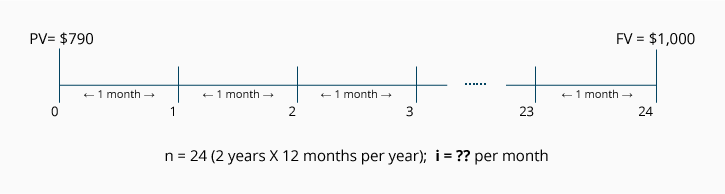
A future amount of $1,000 will be due in exactly two years. The obligation can be settled today for $790. What is the annual interest rate involved in this arrangement if interest is compounded monthly?
The following timeline depicts the information we know, along with the unknown component (i):

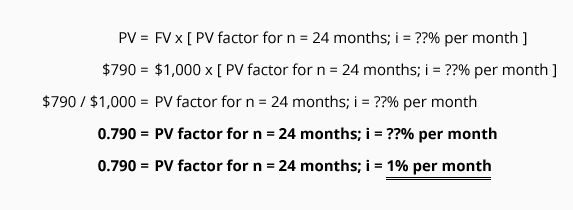
Calculation Using a PV of 1 Table
As the timeline indicates, we know the future value is $1,000 and the present value is $790. Since the interest is compounded monthly, the number of time periods (n) is 24 (2 years x 12 months per year). The unknown component is the monthly interest rate (i).
In equation form, Exercise #10 looks like this:

Our equation tells us that the PV factor is 0.790. Since the number of periods is 24 months, we look at the PV of 1 Table in the row where n = 24 and find the amount closest to 0.790; this would be 0.788. We see it is located in the column where i = 1%.
This tells us that the missing component, the interest rate (i), is approximately 1% per month. However, the exercise asked for the annual interest rate, compounded monthly. The annual interest rate is approximately 12% (the approximate monthly interest rate x 12 months).
Present Value of 1 Used In Recording a Transaction
Let’s use the Present Value (PV) calculation to record an accounting transaction.
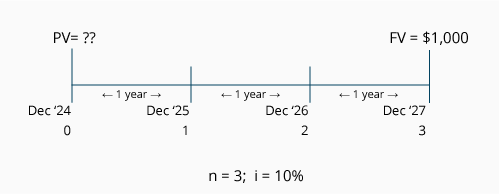
On December 31, 2025, Instafix Co. performed a service for MedHealth, Inc. in exchange for a promissory note for $1,000 that will come due on December 31, 2028. The note does not specify any interest and there is no market for the note. The type of service performed by Instafix Co. is highly customized, meaning the fair market value of the service is not available. Instafix Co.’s accountant must record the transaction on December 31, 2025, keeping in mind the following:
- Instafix Co. cannot record the entire $1,000 as revenue earned in 2025. Because of the time value of money, part of this amount is interest—interest that will not be earned until the years 2026, 2027, and 2028.
- The $1,000 is a future value and is not the present value. The cost principle and the revenue recognition principle require that transactions be recorded at their cash value at the time of the transaction. If the cash value is not known, accountants look to the fair market value of the services provided or the fair market value of the property received (in this case the note). Since those amounts are unknown, the accountant estimates the cash equivalent amount by calculating the present value of the note.
To record the cash equivalent amount through a present value calculation, the accountant must estimate the interest rate (i) appropriate for discounting the future amount to the present time. The rate will reflect the length of time before the money will be received as well as the credit worthiness of MedHealth, Inc. Let’s assume that the appropriate rate is 10% compounded annually.
The following timeline depicts the information we know, along with the unknown component (PV):

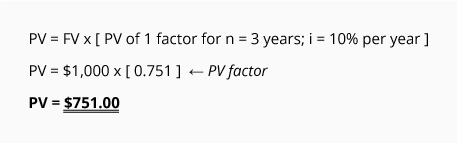
As our timeline indicates, the length of time is three years, the interest rate is 10% compounded annually, and the future cash amount is $1,000. Let’s calculate the present value of this single amount by using a PV of 1 table:

Our calculation shows that receiving $1,000 at the end of three years is the equivalent of receiving approximately $751.00 today, assuming the time value of money is 10% per year compounded annually.
The cost principle (cash or cash equivalent at the time of the transaction) will be satisfied by recording the amount $751. The revenue recognition principle will also be satisfied, because only $751 has been earned (the amount associated with the services performed in December 2025). The $249 difference between $1,000 and $751 is interest that will be earned in the years 2026, 2027, and 2028.
Here is the entry the Instafix Co. accountant records on December 31, 2025:

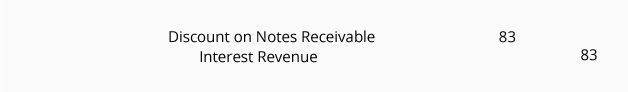
In the years 2026 through 2028, the Instafix Co. will record a total of $249 of interest revenue. If that amount is considered insignificant (with regards to the company’s total net income) the company could simply use the straight-line method to record $83 per year ($249 ÷ 3 years), as shown in the following journal entry:

Over the years 2026 through 2028, the balance in Discount on Notes Receivable will move from a credit balance of $249 to a balance of zero. (Some accountants would describe this as amortizing the $249 balance to Interest Revenue over the life of the note.) At the end of 2028 and just prior to collecting the $1,000 due on the note, the carrying value of the note will be $1,000 (the $1,000 balance in Notes Receivable minus the $0 balance in Discount on Notes Receivable).


Effective Interest Rate Method of Amortizing the Discount
If, however, the $249 of interest is considered significant, then the amount of interest recorded each year should be determined by the effective interest rate method. Under this method, the amount of interest revenue recorded is directly tied to the carrying amount of the note receivable. In other words, each year the interest revenue increases with the increase in the note’s carrying value:

Using the effective interest rate method for interest earned, the journal entries to amortize Discount on Notes Receivable to Interest Revenue over the life of the note are as follows:

After posting these journal entries, the account balances will appear as follows:
The effective interest rate method must be used when the amount of the discount is significant. The reason for requiring this method of amortizing is to exhibit the logical relationship between the carrying value of the note reported on the balance sheet and the interest reported on the income statement.
Where to Go From Here
We recommend taking our Practice Quiz next, and then continuing with the rest of our Present Value of a Single Amount materials (see the full outline below).
We also recommend joining PRO to unlock our premium materials (certificates of achievement, video training, flashcards, visual tutorials, quick tests, quick tests with coaching, cheat sheets, guides, puzzles, business forms, printable PDF files, progress tracking, badges, points, medal rankings, activity streaks, public profile pages, and more).
Disclaimer
You should consider our materials to be an introduction to selected accounting and bookkeeping topics (with complexities likely omitted). We focus on financial statement reporting and do not discuss how that differs from income tax reporting. Therefore, you should always consult with accounting and tax professionals for assistance with your specific circumstances.