Introduction
Businesses often face the need to spend large amounts of money on assets that will be functional for many years. Here are a few examples:
- Equipment to improve an unsafe work situation or to protect the environment
- Equipment to test the consistency of products as required by the customer
- Equipment to package, label, and ship products according to the customer’s specifications
- Equipment to reduce labor costs and improve the quality of products
- Purchase of a building instead of leasing space
Expenditures made for long-term assets are referred to as capital expenditures and are recorded as assets on the balance sheet. During the years that these assets (other than land) are used, their costs are systematically moved from the balance sheet to the income statement through Depreciation Expense.
Note: Our Guide to Managerial & Cost Accounting is designed to deepen your understanding of topics such as product costing, overhead cost allocations, estimating cost behavior, costs for decision making, and more. It is only available when you join AccountingCoach PRO.
WATCH NOW
Advance Your Career with Our PRO Training
Capital Budgeting
Limitations such as time, money, and logistics frequently prevent a company from moving forward with too many major expenditure projects at the same time. Instead, a company will often rank its projects by priority and profitability. By using a process called capital budgeting, the company decides which capital expenditure projects will be undertaken and when.
At the top of the list of capital expenditure projects are those for which no real choice exists (e.g., installing an updated sewer line within the plant to replace one that is leaking, correcting a safety hazard, correcting a code violation, etc). The remaining capital expenditures are usually ranked according to their profitability using a capital budgeting model.
Capital Budgeting Models
There are a number of capital budgeting models available that assess and rank capital expenditure proposals. Let’s take a look at four of the most common models for evaluating business investments:
- Accounting rate of return
- Payback
- Net present value
- Internal rate of return
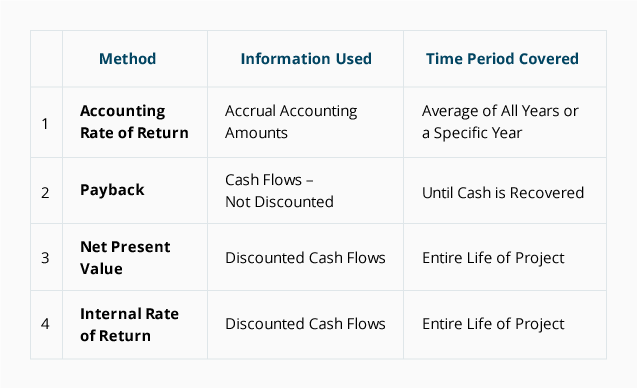
While each of these models has its benefits and drawbacks, sophisticated financial managers prefer the net present value and the internal rate of return methods. There are two reasons why these models are favored: (a) all of the cash flows over the entire length of the project are considered, and (b) the future cash flows are discounted to reflect the time value of money.
The following table highlights the differences among the four models:

Evaluating Capital Expenditures
Let’s use the capital budgeting models to evaluate a potential business investment at Treeline Manufacturing, Inc.:
-
Treeline Manufacturing must decide whether or not it should buy a new machine to replace its existing machine. Because the new machine is faster, it would eliminate the need for a worker now employed to run the existing machine during the evening shift. The initial annual savings are expected to be $24,000, with future cost savings expected to increase $1,000 or more per year.
-
The old machine is fully depreciated and would be scrapped with no expected salvage value (no proceeds).
-
The new machine costs $100,000 and is expected to have no salvage value at the end of its useful life of 8 years. For purposes of financial reporting, the machine would be depreciated over its 8-year life using the straight-line method. For income tax reporting, it would be depreciated over 7 years using the accelerated method. The company’s income tax rate (federal and state combined) is 30%.
-
The new machine would be placed into service on January 1 and a full year of depreciation expense would be recorded on the financial statements during the first year. For income tax purposes our analysis uses a half-year of depreciation during the first year.
-
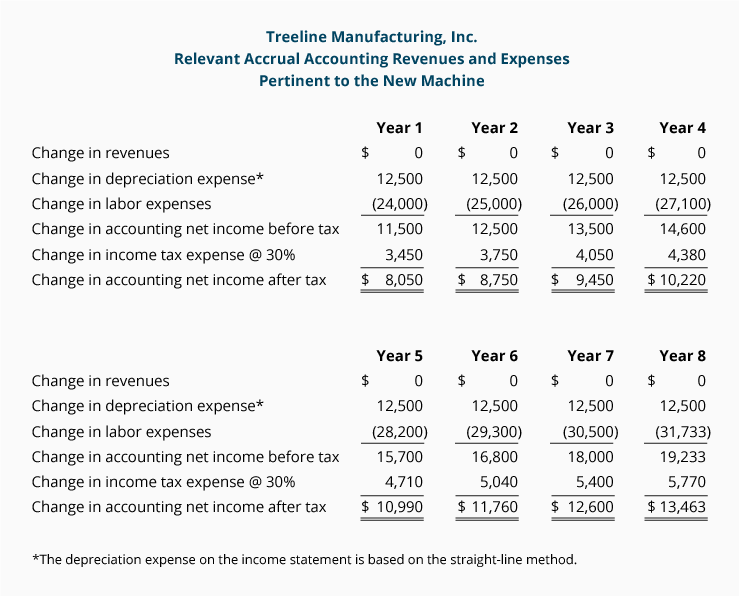
The relevant accrual basis of accounting amounts have been identified as follows (the relevant cash flow amounts will be shown later):

Noncash, Nondiscounted Model
1. Accounting Rate of Return
This method of evaluating business investments considers the profitability of a project based on accrual accounting amounts found in the financial statements. The drawback of the accounting rate of return is that the net income amounts are not adjusted for the time value of money. In other words, $10,000 of net income in Year 4 is considered to be as valuable as $10,000 of net income in Year 1.
If the new machine is purchased, Treeline’s income statements will show a reduction of labor expense of about $24,000 in Year 1 and $31,733 in Year 8—an average of $27,729 during the 8 years. The income statements will also show additional depreciation expense of about $12,500 per year (the $100,000 cost of the machine and a useful life of 8 years with no salvage value). The net result of the average annual labor savings of $27,729 minus the additional annual depreciation expense of $12,500 is an average of $15,229 of additional net income before income tax expense. Assuming a combined federal and state income tax rate of 30%, the net income after income tax expense will average approximately $10,660 per year.
Treeline’s balance sheet will start with the new asset’s carrying amount (or the book value) of $100,000. The book value will decrease to $0 at the end of 8 years. In other words, the balance sheet amount will average about $50,000 per year during the 8-year period.
At this point, Treeline must choose one of the following calculations to estimate the accounting rate of return. (As with most “return” calculations, the numerator comes from the income statement and the denominator comes from the balance sheet.)
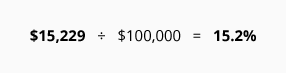
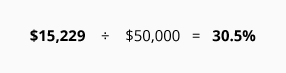
- Average additional accounting net income before income tax expense ÷ the additional original investment:

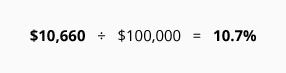
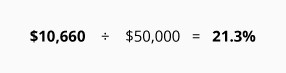
- Average additional accounting net income after income tax expense ÷ the additional original investment:
- Average additional accounting net income before income tax expense ÷ the additional average investment:
- Average additional accounting net income after income tax expense ÷ the additional average investment:
As you can see, the calculation Treeline chooses depends on (a) whether the company prefers to use before tax or after tax average accounting net income, and (b) whether it prefers to use the initial investment amount or the average investment amount.
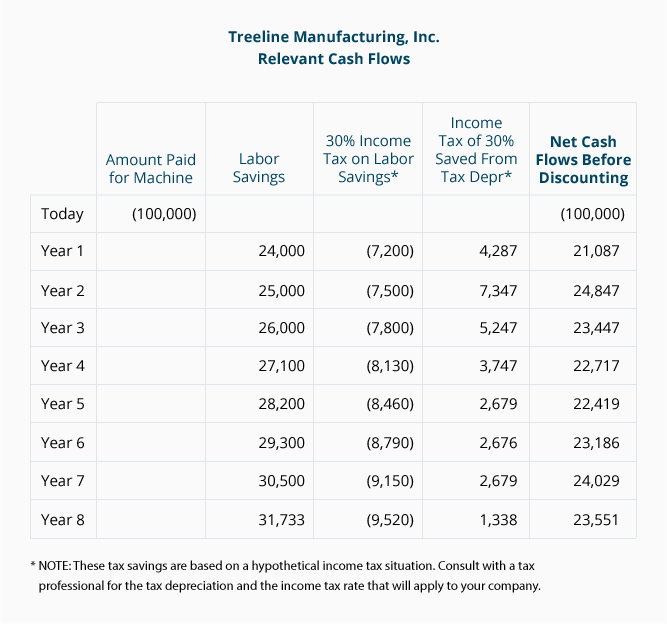
Cash Flows
The company’s cash flows are not the same as the accounting net income amounts that are based on accrual accounting. The following table shows the cash received or saved as positive amounts, and the cash that was paid out or lost as negative amounts (in parentheses).

Nondiscounted Cash Flow Model
2. Payback
This method of evaluating business investments uses cash flows (not the accounting net income flows) to measure the amount of time it takes for a company to recoup its investment dollars.
There are two drawbacks to the payback model: (a) cash flows are not discounted for the time value of money, meaning that a dollar received three years from now has the same value as a dollar received in the current year, and (b) it fails to consider the profitability of the project in its entirety. For example, a project with a fast initial payback might not generate much profit over its life. Another project with a slow initial payback might be phenomenally profitable over its life because its profitability increases dramatically after the payback period.
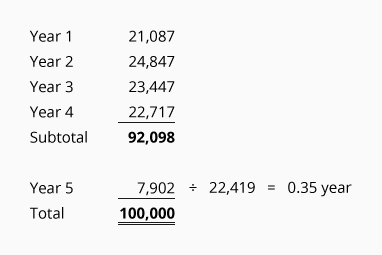
Using the net cash flows before discounting in the table above, the payback period on the new machine for Treeline is 4.35 years:

Discounted Cash Flow Models
3. Net Present Value
This method of evaluating business investments estimates all of the cash flowing in and out of a project. The estimated cash flows are then discounted to the present to reflect the time value of money.
This technique is referred to as a discounted cash flow model or a present value model because it brings all of the estimated future cash amounts back to the present time. Using our Treeline Manufacturing example, the estimated cash flows in Year 5 will be discounted more than the estimated cash flows in Year 1 because cash received in the future is less valuable than cash received today.
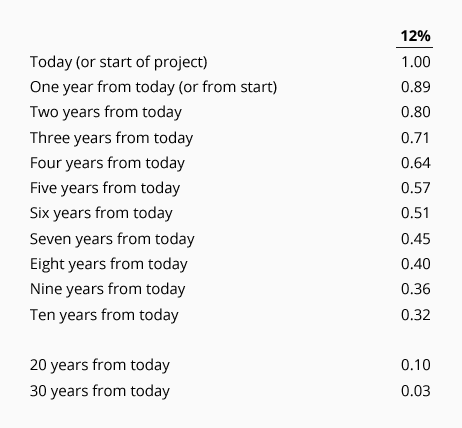
Present value tables and financial calculators allow us to discount future cash amounts to the present time. Below is a portion of a present value table. It shows the value today (the present value) of receiving (or paying) one dollar at various points in time when the time value of money is 12%:

From this table you can see that if the time value of money is 12%, receiving $1.00 in ten years is equivalent to receiving $0.32 today.
In the net present value model the company must specify the rate it will use for discounting the future cash flows. (The rate selected will likely be the minimum that the company needs to earn on the project after uncertainties, risks, and the company’s cost of capital are considered.) The combination of the present value of the cash inflows and the present value of the cash outflows is known as the net present value.
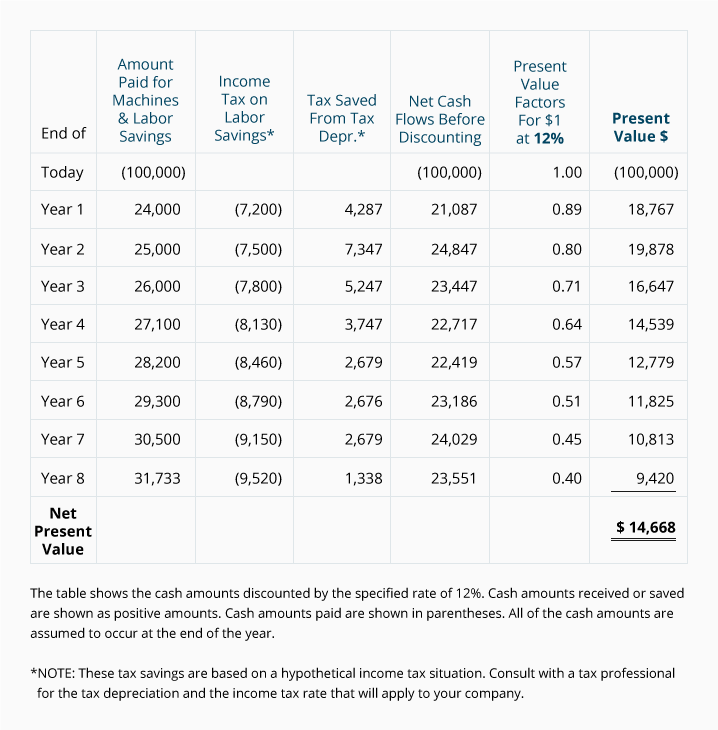
Assuming that Treeline chose to use a rate of 12%, let’s calculate the net present value of the relevant cash amounts for Treeline’s proposed purchase:

When the net present value is a positive amount, the project is earning more than the rate used to discount the cash flows. As you can see from the above table, Treeline’s proposed project is showing a positive net present value of $14,668. This means that the new machine will provide Treeline with $14,668 more in present value dollars than the minimum specified return of 12%.
A net present value of $0 would indicate that a project is expected to earn exactly the rate used to discount the future cash flows. If the net present value is a negative amount, the project will earn less than the rate used to discount the cash flows. (This doesn’t mean, however, that the project is showing a negative return—it could be the project is earning a return of 11% instead of the specified rate of 12%.)
4. Internal Rate of Return
This discounted cash flow model calculates the rate that will cause the net present value to equal zero. In other words, it answers the question, “What rate of return will the project earn over its life?” It is similar to the net present value method in that (a) all of the estimated cash flows over the entire life of the project are considered, and (b) the estimated cash flows are discounted to the present.
Since the internal rate of return model produces the rate that will discount all of the cash back to a net present value of exactly zero, you may need to try various rates (as shown in present value tables) until you find the exact rate that gives you zero. (You will save time by using a computer, financial calculator, or programmable calculator.)
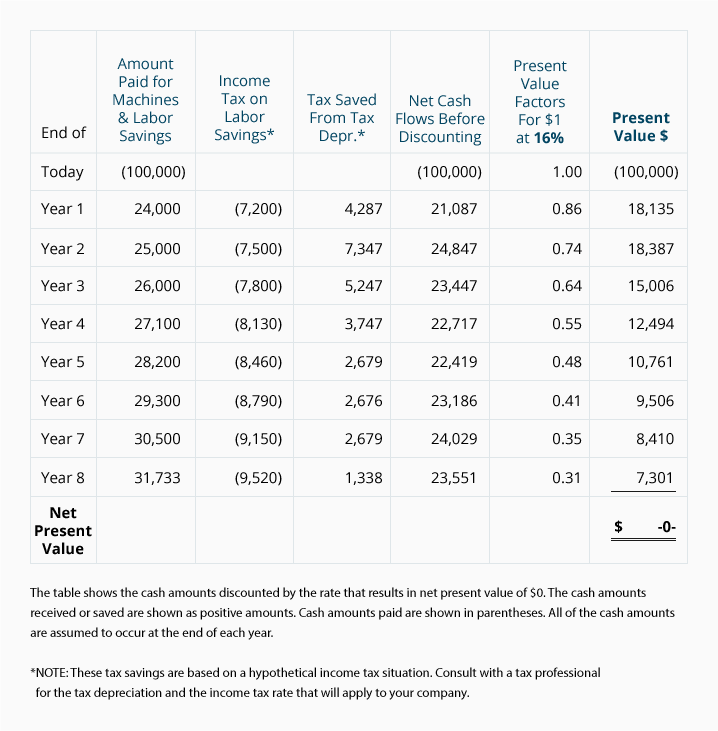
As you can see below, Treeline finds that a rate of 16% will yield a net present value of $0:
Knowing that the project has an internal rate of return of 16% may be more useful to Treeline than knowing its net present value is $14,668. In fact, if this method is applied to all of its capital expenditure proposals, Treeline can easily rank the proposals according to profitability. For example, if Treeline decides to commit no more than $500,000 for nonemergency projects, it can start by funding those proposals which show the highest internal rate of return and work its way down the list until the entire $500,000 is committed.
Another Application of a Present Value Calculation
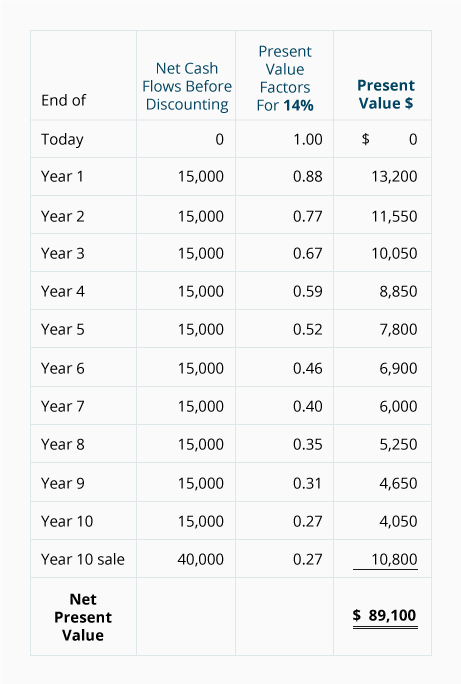
A savvy company (or individual) will use the net present value method to help determine the amount it should spend to acquire another business. For example, assume that you wish to purchase Kirkland Co. You expect that the Kirkland Co. will generate positive net cash flows after tax of $15,000 per year for ten years, at which time you plan to liquidate or sell the company for $40,000 after taxes. To cover the risk associated with your investment in Kirkland Co. you need to earn 14%. With that in mind, what is the maximum amount you should pay today for Kirkland Co.?
The net present value method will give us the amount to be paid in order to earn 14%. The following table shows the required calculations:

If you purchase the Kirkland Co. for $89,100 you will earn exactly a 14% return if the cash flows occur as estimated. If you pay more than $89,100 you will earn less than a 14% return; a price of less than $89,100 means you will earn more than a 14% return.
To learn the rate that you will earn on a specific price, you can compute the internal rate of return. This is done by finding the rate that will discount the future cash amounts back to the price.
Where to Go From Here
We recommend taking our Practice Quiz next, and then continuing with the rest of our Evaluating Business Investments materials (see the full outline below).
We also recommend joining PRO to unlock our premium materials (certificates of achievement, video training, flashcards, visual tutorials, quick tests, quick tests with coaching, cheat sheets, guides, puzzles, business forms, printable PDF files, progress tracking, badges, points, medal rankings, activity streaks, public profile pages, and more).
Disclaimer
You should consider our materials to be an introduction to selected accounting and bookkeeping topics (with complexities likely omitted). We focus on financial statement reporting and do not discuss how that differs from income tax reporting. Therefore, you should always consult with accounting and tax professionals for assistance with your specific circumstances.