Introduction
Financial ratios relate or connect two amounts from a company’s financial statements (balance sheet, income statement, statement of cash flows, etc.). The purpose of financial ratios is to enhance one’s understanding of a company’s operations, use of debt, etc.
The use of financial ratios is also referred to as financial ratio analysis or ratio analysis. That along with vertical analysis and horizontal analysis (all of which we discuss) are part of what is known as financial statement analysis.
Benefit of Financial Ratios
A significant benefit of calculating a company’s financial ratios is being able to make comparisons with the following:
- The averages for the industry in which the company operates
- The ratios of another company in its industry
- Its own ratios from previous years
- Its planned ratios for the current and future years
The comparisons may direct attention to areas within a company that need improvement or where competitors are more successful.
Limitations of Financial Ratios
Some of the limitations of financial ratios are:
-
They are based on just a few amounts taken from the financial statements from a previous year. Current and future years could be different due to innovations, economic conditions, global competitors, etc.
-
The comparison is useful only with companies in the same industry. This becomes difficult when other companies operate in several industries and their financial statements report only consolidated amounts.
-
Companies may apply accounting principles differently. For instance, some U.S. companies use LIFO to assign costs to its inventory and cost of goods sold, while some use FIFO. Some companies will be more conservative when estimating the useful life of equipment, when recording an expenditure as an expense rather than as an asset, and more.
-
Since financial statements reflect the historical cost principle, some of a company’s most valuable assets (trade names, logos, unique reputation, etc. that were developed internally) are not reported on the company’s balance sheet.
-
They provide a minuscule amount of information compared to the information included in the five main financial statements and the publicly traded corporation’s annual report to the U.S. Securities and Exchange Commission (SEC Form 10-K).
Our Discussion of 15 Financial Ratios
Our explanation will involve the following 15 common financial ratios:
Financial ratios using balance sheet amounts
- Ratio #1 Working capital
- Ratio #2 Current ratio
- Ratio #3 Quick (acid test) ratio
- Ratio #4 Debt to equity ratio
- Ratio #5 Debt to total assets
Financial ratios using income statement amounts
- Ratio #6 Gross margin (gross profit percentage)
- Ratio #7 Profit margin
- Ratio #8 Earnings per share
- Ratio #9 Times interest earned (interest coverage ratio)
Financial ratios using amounts from the balance sheet and the income statement
Financial ratios using cash flow statement amounts
We also include a discussion of vertical analysis (resulting in common-size income statements and balance sheets) and horizontal analysis (resulting in comparative financial statements and trends over longer time periods).
Lastly, we will give you practice examples (with solutions) so you can test yourself to see if you understand what you have learned. Calculating the 15 financial ratios and reviewing your answers will improve your understanding and retention.
NOTE: If you want to learn more about financial statements, visit any of the following Explanations:
WATCH NOW
Advance Your Career with Our PRO Training
Financial Ratios Using Balance Sheet Amounts
We begin our discussion of financial ratios with five financial ratios that are calculated from amounts reported on a company’s balance sheet.
The following financial ratios are often labeled as liquidity ratios since they provide some indication of a company’s ability to pay its obligations when they come due:
- Ratio #1 Working capital
- Ratio #2 Current ratio
- Ratio #3 Quick (acid test) ratio
There are two additional financial ratios based on balance sheet amounts. These ratios provide information on a corporation’s use of debt or financial leverage:
- Ratio #4 Debt to equity ratio
- Ratio #5 Debt to total assets
Ratio #1 Working Capital
Working capital is defined as the amount remaining after subtracting a corporation’s total amount of current liabilities from the total amount of its current assets. (In most industries, current assets include cash and assets that are expected to turn to cash within one year. Current liabilities are the obligations that will be due within one year.)
The formula for determining the amount of working capital is:
Working capital = current assets – current liabilities
Generally, the larger the amount of working capital, the more likely a company will be able to pay its suppliers, lenders, employees, etc. when the amounts are due. It also means less stress when an unexpected problem arises.
The amount of working capital that a company needs will vary by industry (and could vary by company within the same industry). Here are some factors that determine the amount needed:
- Type of business (manufacturer, retailer, service provider, etc.)
- Size of the business
- Amount of sales on credit terms such as net 30 days
- Competition
- Composition of the current assets (cash is far different from inventory)
- Dates when the current liabilities must be paid (next week or 10 months from now)
- Age/condition of the assets used in the business (older equipment may require more repairs)
- Financing arrangements (such as an approved and unused line of credit)
- Emergencies that arise unexpectedly
- More insights can be found in our Working Capital and Liquidity Explanation
Here are two examples that illustrate how to calculate the amount of a company’s working capital:
Example 1A
ABC is a large manufacturing corporation with $4,200,000 of current assets and $4,000,000 of current liabilities. Therefore, ABC’s working capital is:
Working capital = current assets – current liabilities
Working capital = $4,200,000 – $4,000,000
Working capital = $200,000
ABC’s working capital of $200,000 seems too little for a large manufacturer having $4,000,000 of current liabilities coming due within the next year. However, if the company has a standard product that it produces continuously for a customer that pays upon delivery, the $200,000 of working capital may be adequate. On the other hand, if this manufacturer must carry a huge amount of inventory of raw materials and finished products and the demand for the products varies from month to month, the $200,000 may be far short of the amount needed.
Example 1B
Beta Company is an internet business with lots of sales every day to customers who pay with a credit card when ordering. If Beta Company has $35,000 of current assets and $20,000 of current liabilities, its working capital is:
Working capital = current assets – current liabilities
Working capital = $35,000 – $20,000
Working capital = $15,000
Since Beta Company is a service business, it is unlikely to have a large amount of inventory of goods as part of its current assets. Perhaps most of Beta’s current assets are in cash. If these assumptions are correct, Beta might operate comfortably with less than $15,000 of working capital.
Example 1A and Example 1B bring to light the difficulty in determining the amount of working capital needed by a specific business. For more insights, visit our Working Capital and Liquidity Explanation.
Ratio #2 Current Ratio
The current ratio, which is sometimes referred to as the working capital ratio, is defined as a company’s total amount of current assets divided by the company’s total amount of current liabilities. Expressed as a formula, the current ratio is:
Current ratio = current assets / current liabilities
Generally, the larger the ratio of current assets to current liabilities the more likely the company will be able to pay its current liabilities when they come due.
The following factors are relevant for determining the appropriate current ratio for a company as well as working capital (Ratio #1):
- Type of business (manufacturer, retailer, service provider, etc.)
- Size of the business
- Amount of sales on credit terms such as net 30 days
- Competition
- Composition of the current assets (cash is far different from inventory)
- Dates when the current liabilities must be paid (next week or 10 months from now)
- Age/condition of the assets used in the business (older equipment may require more repairs)
- Financing arrangements (such as an approved and unused line of credit)
- Emergencies that arise unexpectedly
- More insights can be found in our Working Capital and Liquidity Explanation
Since current assets divided by current liabilities results in a ratio (unlike the amount of working capital), the current ratio can be compared to a smaller company’s current ratio or to a larger company’s current ratio within the same industry.
Example 2A
ABC is a large manufacturing corporation with $4,200,000 of current assets and $4,000,000 of current liabilities. Therefore, ABC’s current ratio is:
Current ratio = current assets / current liabilities
Current ratio = $4,200,000 / $4,000,000
Current ratio = 1.05 (or 1.05 to 1 or 1.05:1)
ABC’s current ratio of 1.05 seems small for a large manufacturer with $4,000,000 of current liabilities. In the past, many people believed that the ideal current ratio was 2 (having twice as many current assets as current liabilities). Today, we should consider many factors when attempting to find the optimum current ratio for a business. The factors for a manufacturer include:
- The consistency of its sales and production
- How fast customers pay
- Levels of inventory required
- Dates when current liabilities must be paid
- And many more factors. Our Working Capital and Liquidity Explanation provides additional insights.
Example 2B
Beta Company is an internet business with significant daily sales to customers who must pay with a credit card when ordering. If Beta Company had $35,000 of current assets and $20,000 of current liabilities, its current ratio at that moment would be:
Current ratio = current assets / current liabilities
Current ratio = $35,000 / $20,000
Current ratio = 1.75 (1.75 to 1 or 1.75:1)
Since Beta Company is not a manufacturer or retailer, it will have little or no inventory. If its current assets consist mainly of cash and receivables from long-time customers who pay promptly, Beta may operate with a ratio of 1.00 (or even less) if its revenues are consistent.
Ratio #3 Quick (Acid Test) Ratio
The quick ratio is commonly known as the acid test ratio. The quick ratio is more conservative than the current ratio because the amounts of a company’s inventory and prepaid expenses are not included. (It is assumed that inventory and prepaid expenses cannot be turned into cash quickly.)
As a result, only the company’s “quick” assets consisting of cash and cash equivalents, temporary investments, and accounts receivable are divided by the total amount of the company’s current liabilities. For companies with inventory (manufacturers, retailers, distributors) the quick ratio is viewed as a better indicator (than the current ratio) of those companies’ ability to pay their obligations when they come due.
The formula for the quick ratio is:
Quick ratio = (cash + cash equivalents + temp. investments + accounts receivable) / current liabilities
Whether a company’s quick ratio is sufficient will again depend on factors such as:
- The makeup of the quick assets
- How fast customers pay for the goods or services provided by the company
- The dates that the current liabilities must be paid
- Financing arrangements
Example 3A
To illustrate the quick ratio, assume that on December 31, a large manufacturing corporation has $4,200,000 of current assets and $4,000,000 of current liabilities. However, the $4,200,000 of current assets includes $2,600,000 of inventory and prepaid expenses. As a result, its “quick” assets (cash + cash equivalents + temporary investments + accounts receivable) amount to $1,600,000 ($4,200,000 – $2,600,000). The corporation’s quick ratio as of December 31 is calculated as follows:
Quick ratio = (cash + cash equivalents + temp. investments + accounts receivable) / current liabilities
Quick ratio = $1,600,000 / $4,000,000
Quick ratio = 0.40 (0.40 to 1 or 0.40:1)
Obviously, a manufacturer and retailer will have a quick ratio that is significantly smaller than its current ratio. This corporation’s quick ratio of 0.40 will require the business to get its inventory items sold in time to collect the cash needed to pay its current liabilities when they come due. This may or may not be a problem depending on the customers and the demand for the corporation’s goods.
Example 3B
Assume that Beta Company is an internet business with lots of sales every day and customers pay when ordering. Beta’s current assets of $35,000 includes $9,000 of inventory and $1,000 of prepaid expenses. Therefore, the amount of Beta’s “quick assets” (cash + cash equivalents + temporary investments + accounts receivable) is $25,000 ($35,000 – $9,000 – $1,000). If Beta Company has $20,000 of current liabilities, the calculation of its quick ratio is:
Quick ratio = quick assets / current liabilities
Quick ratio = $25,000 / $20,000
Quick ratio = 1.25 (1.25 to 1 or 1.25:1)
If Beta’s quick assets are mostly cash and temporary investments, it has a great quick ratio.
This concludes our discussion of the three financial ratios using the current asset and current liability amounts from the balance sheet. As mentioned earlier, you can learn more about these financial ratios in our Working Capital and Liquidity Explanation.
Next, we will look at two additional financial ratios that use balance sheet amounts. These financial ratios give us some insight on a corporation’s use of financial leverage.
Ratio #4 Debt to Equity Ratio
The debt to equity ratio relates a corporation’s total amount of liabilities to its total amount of stockholders’ equity.
NOTE:
Unless a financial ratio specifies “long-term debt”, you should assume that “debt” means the total amount owed to creditors, or the total amount of liabilities. As a formula, debt is:
Debt = the amount of current liabilities + the amount of noncurrent (long-term) liabilities
The debt to equity ratio is calculated by dividing a company’s total amount of liabilities by its total amount of stockholders’ equity:
Debt to equity ratio = total liabilities / total stockholders’ equity
A corporation’s use of some debt is considered wise for the following reasons:
- Interest on debt is deductible from the taxable income of a U.S. corporation
- The cost of borrowed money (interest expense) is less than the cost of having additional shares of stock
- The corporation can acquire and control more assets without diluting its existing stockholders’ ownership interest
However, too much debt is risky because the corporation may not be able to obtain additional loans to cover the cost of unexpected problems.
Example 4A
Assume that on December 31, ABC Corporation had $4,200,000 of current assets and $5,800,000 of noncurrent (long-term) assets resulting in total assets of $10,000,000. ABC also had current liabilities of $4,000,000 and $3,200,000 of noncurrent liabilities resulting in total liabilities of $7,200,000. Its total stockholders’ equity was $2,800,000. Given this information, ABC Corporation’s debt to equity ratio on December 31 was:
Debt to equity ratio = total liabilities / total stockholders’ equity
Debt to equity ratio = $7,200,000 / $2,800,000
Debt to equity ratio = 2.57 (2.57 to 1 or 2.57:1)
As ABC’s debt to equity ratio of 2.57 indicates, the corporation is using a large amount of creditors’ money in relation to its stockholders’ money. We would say the company is highly leveraged and that could be a factor in whether the corporation can borrow more money if needed for an emergency or economic downturn.
One should look at the average debt to equity ratio for the industry in which ABC operates as well as the debt to equity ratio of its competitors to gain more insights.
Example 4B
Assume that Beta Company has the following: current assets of $35,000; noncurrent assets of $65,000; current liabilities of $20,000; noncurrent liabilities of $25,000; total stockholders’ equity of $55,000. Beta Company’s debt to equity ratio is calculated as follows:
Debt to equity ratio = total liabilities / total stockholders’ equity
Debt to equity ratio = $45,000 / $55,000
Debt to equity ratio = 0.82 (0.82 to 1 or 0.82:1)
Beta’s debt to equity ratio looks good in that it has used less of its creditors’ money than the amount of its owner’s money.
Ratio #5 Debt to Total Assets
The debt to total assets ratio is also an indicator of financial leverage. This ratio shows the percentage of a business’s assets that have been financed by debt/creditors. The remainder comes from the owners of the business. Generally, a lower ratio of debt to total assets is better since it is assumed that relatively less debt has less risk.
[Our discussion of the debt to equity ratio (Ratio #4 above), highlighted some of the pros and cons of using debt instead of equity when purchasing business assets.]
Recalling that debt means the company’s total amount of liabilities or the total amount owed to creditors, the debt to total assets ratio is calculated by dividing a company’s total amount of liabilities by its total amount of assets.
Here is the formula for the debt to total assets ratio:
Debt to total assets = total liabilities / total assets
Example 5A
ABC Corporation’s most recent balance sheet reported total assets of $10,000,000 and total liabilities of $7,200,000. ABC’s debt to total assets ratio as of the balance sheet date was:
Debt to total assets = total liabilities / total assets
Debt to total assets = $7,200,000 / $10,000,000
Debt to total assets = 0.72 or 72% (or 0.72 to 1 or 0.72:1)
This indicates that 72% of the cost of total assets reported on ABC’s balance sheet assets were financed by its lenders and other creditors. The remaining 28% were financed by ABC’s stockholders.
Whether 72% is a good debt to total assets ratio depends on the assets, the cost of the debt, and lots of unknown factors in the future.
A debt to total assets ratio of 72% may be acceptable at a growing company where long-term loans were needed to purchase labor saving equipment and construct more efficient facilities (instead of paying rent for inefficient facilities).
On the other hand, when the debt resulted from operating losses caused by declining demand and poor management, a debt to total assets ratio of 72% may be risky and may prevent the company from obtaining additional loans.
Example 5B
Beta Company’s recent balance sheet reported total assets of $100,000 and total liabilities of $45,000. Therefore, Beta Company’s debt to total assets ratio as of the date of the balance sheet was:
Debt to total assets = total liabilities / total assets
Debt to total assets = $45,000 / $100,000
Debt to total assets = 0.45 or 45% (or 0.45 to 1 or 0.45:1)
Whether 45% is a good ratio of debt to total assets depends on future conditions. However, as a general rule, a lower ratio of debt to total assets is considered better since there is less risk of loss for a lender and the company may be able to obtain additional loans if needed.
Financial Ratios Using Income Statement Amounts
In this section we discuss the following financial ratios which involve amounts reported on a company’s income statement:
- Ratio #6 Gross margin (gross profit percentage)
- Ratio #7 Profit margin
- Ratio #8 Earnings per share
- Ratio #9 Times interest earned (interest coverage ratio)
These ratios, which are often based on transactions that occurred during the previous year, are most meaningful when they are compared to:
- The company’s own ratios from another year
- The company’s targeted or planned ratios
- The ratios of other companies in the same industry during the same accounting period
- Averages for the industry in which the company operates
Ratio #6 Gross Margin (Gross Profit Percentage)
In the context of financial ratios, the term gross margin is the percentage of net sales remaining after subtracting the cost of goods sold. In this context, gross margin means the same as the gross profit as a percentage of net sales.
NOTE:
Net sales = gross sales – sales discounts – sales returns – sales allowances
You should also be aware that some people will use the term gross margin to mean the dollars of gross profit.
Example 6
Last year, XYZ Corporation had net sales of $8,000,000 and its cost of goods sold was $6,000,000. As a result, XYZ’s gross profit was $2,000,000. In the context of financial ratios, the gross margin is a percentage of net sales as shown in this formula:
Gross margin = gross profit / net sales
Gross margin = $2,000,000 / $8,000,000
Gross margin = 0.25 or 25%
Generally, net sales and the cost of goods sold are the two largest amounts on the income statements of companies that sell goods. Accordingly, a company’s gross margin (as a percentage of net sales) is monitored closely by financial analysts who want to see if the company was able to increase selling prices when the company experienced increased costs, or if the company was able to maintain its gross margin when faced with increased competition.
Even when comparing a company’s gross margin to other companies in the same industry, some differences can be the result of how accounting principles are applied. For instance, some U.S. companies use the last-in, first-out (LIFO) method for assigning actual costs to inventory and to the cost of goods sold. Other companies in the same industry may be using the first-in, first-out (FIFO) method. During periods of inflation (or deflation), this will result in a difference in the companies’ gross margins. (You can learn more about this in our Inventory and Cost of Goods Sold Explanation.)
Gross margins (as a percent of net sales) can also vary within the same industry due to marketing strategies. For example, one retailer may sell goods at their full selling prices and provide extensive customer service. Its gross margins will be higher than another retailer who sells goods at discounted prices and provides a minimum of customer service. (However, the retailer providing the extensive customer service will likely experience higher selling expenses that offset some of its larger gross margins.)
Ratio #7 Profit Margin
A company’s profit margin (as opposed to gross margin) is the percentage of net sales remaining after all expenses are subtracted from net sales. Expenses that are subtracted from net sales include the following:
A company’s profit margin can be calculated before income tax expense, and/or after income tax expense as shown in these formulas:
Profit margin before tax = net income before tax / net sales
Profit margin after tax = net income after tax / net sales
Example 7
Assume that XYZ is a regular corporation which had $8,000,000 of net sales (gross sales minus sales discounts, returns and allowances). Its expenses were: cost of goods sold of $6,000,000; SG&A expenses of $1,250,000; interest expense of $30,000; and income tax expense of $160,000.
XYZ’s profit margin before tax is calculated as follows:
Profit margin before tax = net income before tax / net sales
Profit margin before tax = [$8,000,000 – ($6,000,000 + $1,250,000 + $30,000) / $8,000,000]
Profit margin before tax = ($8,000,000 – $7,280,000) / $8,000,000
Profit margin before tax = $720,000 / $8,000,000
Profit margin before tax = 9%
XYZ’s profit margin after tax is calculated as follows:
Profit margin after tax = net income after tax / net sales
Profit margin after tax = [$8,000,000 – ($6,000,000 + $1,250,000 + $30,000 + $160,000) / $8,000,000]
Profit margin after tax = ($8,000,000 – $7,440,000) / $8,000,000
Profit margin after tax = $560,000 / $8,000,000
Profit margin after tax = 7%
Whether the corporation’s 9% pretax profit margin or its 7% after-tax profit margin is good depends on several factors, including:
- The profit margins in its industry
- The corporation’s profit margins that were attained in prior years
- The corporation’s planned profit margins (perhaps the goal was to improve each by a minimum of one percentage point) for the current year
NOTE:
Included in the salaries and fringe benefits expenses on a regular corporation’s income statement is the compensation earned by stockholders who work in the corporation. This is different from a sole proprietorship or partnership income statement where owners do not receive salaries and other compensation. (Instead they get draws, which are not listed as an expense.) Therefore, the profit margin of sole proprietorship or partnership cannot be directly compared to that of a regular corporation.
When comparing companies’ profit margins, there can be a difference in the reporting of income tax expense. The income statement of a regular corporation includes the corporation’s income tax expense. On the other hand, the income statement of a sole proprietorship or partnership does not report income tax expense. (The reason is that the income tax for the sole proprietorship or partnership is reported on the owners’ personal income tax returns.)
In summary, the regular corporation’s income statement will have two expenses that do not appear on the income statement of a sole proprietorship or partnership:
- Salaries and fringe benefits expense for the owners
- Income tax expense
Ratio #8 Earnings Per Share
Corporations with only common stock outstanding
If a corporation’s common stock is publicly traded, the corporation must also report its net income after tax as earnings per share (EPS) on the face of its income statement.
If a corporation has only common stock (no preferred stock, no securities convertible into common stock) and the corporation had the same number of shares of common stock outstanding throughout the entire accounting year, the calculation of the earnings per share is simple:
Earnings per share = net income after tax / number of shares of common stock outstanding
Example 8A
Assume that XYZ is a corporation with common stock that is publicly traded. If XYZ’s net income after tax was $560,000 and it had 100,000 shares of common stock outstanding throughout the entire year, XYZ’s earnings per share is calculated as follows:
Earnings per share = net income after tax / number of shares of common stock outstanding
Earnings per share = $560,000 /100,000 shares
Earnings per share = $5.60
Corporations with both common stock and preferred stock outstanding
If a corporation has common and preferred stock and no change in the number of common shares outstanding during the entire year, the EPS calculation requires two steps:
- Earnings available for common stock = net income after tax – required dividend on the preferred stock
- Earnings per share = earnings available for common stock / number of shares of common stock outstanding
Example 8B
Assume that XYZ is a corporation with 100,000 shares of common stock that is outstanding and publicly traded. In addition, XYZ has 1,000 shares of preferred stock which requires an annual dividend of $40,000. (The dividends on common and preferred stock are not expenses of the corporation.) Assuming that XYZ’s net income after tax was $560,000 and it had 100,000 shares of common stock outstanding throughout the entire year, its earnings per share is calculated as follows:
-
Earnings available for common stock = net income after tax – required dividend on preferred stock
Earnings available for common stock = $560,000 – $40,000
Earnings available for common stock = $520,000
-
Earnings per share = earnings available for common stock / number of shares of common stock outstanding
Earnings per share = $520,000 / 100,000 shares
Earnings per share = $5.20
The calculations of earnings per share will be more complicated when any of the following have occurred:
- Additional shares of common stock were issued during the year
- The corporation purchased some of its shares of common stock during the year
- There are securities or financial instruments that are convertible into the corporation’s common stock
NOTE:
Sometimes a corporation uses its cash to purchase shares of its own common stock. If the shares are not retired, the shares are known as treasury stock.
Whenever a corporation purchases shares of its common stock, the number of outstanding shares of common stock will decrease. Hence, the corporation’s net income after tax will be divided by a smaller number of outstanding shares of common stock. This will cause the corporation’s earnings per share (EPS) to increase. This in turn often causes an increase in the market value of each share of common stock.
The purchase of its own common stock may be an attractive option for a corporation with no lucrative investments available and its stockholders do not want to receive taxable dividends. However, purchasing shares of its own stock does reduce the corporation’s cash available to meet future obligations including unforeseen problems. In terms of financial ratios, this use of cash will decrease the corporation’s working capital, current ratio, and quick ratio.
Whether a corporation’s earnings per share (EPS) amount is good depends on many factors including the corporation’s goals, the corporation’s rate of growth in the EPS amount, the competitors’ rate of growth in their EPS, stock market’s expectation of the corporation’s EPS, and more.
Ratio #9 Times Interest Earned (Interest Coverage Ratio)
Times interest earned, which is also known as the interest coverage ratio, is an indicator of a corporation’s ability to pay the interest on its debt, such as loans payable and bonds payable.
The times interest earned ratio is calculated by dividing a corporation’s net income before income taxes and before interest expense for a recent year by the interest expense for the same year. The formula for the interest coverage ratio is:
Times interest earned = net income before interest and income tax expense / interest expense
Example #9
Assume that XYZ Corporation had net income after income tax (commonly referred to as earnings) of $560,000. Also assume that the income statement had reported interest expense of $30,000 and income tax expense of $160,000. From this information, we need to determine the net income before tax and before interest expense. This can be done by adding the interest expense and income tax expense to the net income after tax. The calculation of the times interest earned ratio is:
Times interest earned = net income before interest and income tax expenses / interest expense
Times interest earned = ($560,000 net income after tax + $30,000 + 160,000) / $30,000
Times interest earned = $750,000 / $30,000
Times interest earned = 25 times
A high times interest earned ratio gives the lender comfort that the borrower will be able to make the interest payments when they are due.
Financial Ratios Using Amounts from the Balance Sheet and Income Statement
In this section, we will discuss five financial ratios which use an amount from the balance sheet and an amount from the income statement. Specifically, we will discuss the following:
- Ratio #10 Receivables turnover ratio
- Ratio #11 Days’ sales in receivables (average collection period)
- Ratio #12 Inventory turnover ratio
- Ratio #13 Days’ sales in inventory (days to sell)
- Ratio #14 Return on stockholders’ equity
The first four of the above ratios inform us about a company’s speed in:
- Collecting (turning over) its accounts receivable
- Selling (turning over) its goods in inventory
The speed at which a company is able to convert its accounts receivable and inventory into cash is crucial for the company to meet its payroll, pay its suppliers, and pay other current liabilities when the amounts are due. In other words, a company could have a huge amount of working capital and an impressive current ratio, but it requires that the current assets be converted to cash to pay the bills.
Therefore, a higher receivables turnover ratio (Ratio #10) and a higher inventory turnover ratio (Ratio #12) are better than lower ratios. These higher turnover ratios mean there will be less days’ sales in receivables (Ratio #11) and less days’ sales in inventory (Ratio #13). Having less days in receivables and inventory are better than a higher number of days.
Recall that the amounts reported on the balance sheet are as of an instant or point in time, such as the final moment of an accounting year. Therefore, a balance sheet dated December 31 provides a “snapshot” of the pertinent general ledger account balances (assets, liabilities, equity) as of the final moment of December 31.
Also recall that the income statement reports the cumulative amounts of revenues, expenses, gains, and losses that occurred during the entire 12 months that ended on December 31.
NOTE:
To overcome this mismatch of comparing an income statement amount (such as the cumulative sales for the entire year) to a balance sheet amount (such as the accounts receivable balance at the final moment of the year), we need the balance sheet amount to be an average amount that is representative of all the days during the year.
Graphing the daily (or perhaps weekly) balances during the year and then computing an average of those many data points will provide a representative average. Unfortunately, people outside of the company do not have access to those details.
As an alternative, outsiders often compute an average based on the end-of-the-year moment for the current year and the previous year. (They do this without regard to whether these end-of-the-year balances are much lower than the balances during the year.)
Ratio #10 Receivables Turnover Ratio
The receivables turnover ratio (or accounts receivable turnover ratio) relates a company’s net credit sales from the most recent year to the amount the customers owed the company during that year.
NOTE:
Net credit sales = gross credit sales (cash sales are excluded) minus any related sales discounts, sales returns, and sales allowances.
If a new startup company makes its first sale with credit terms of net 30 days, the company records the sale by increasing Accounts Receivable and increasing Sales on Credit. If the customer pays in 30 days, the company will increase Cash and will decrease Accounts Receivable. This means that the company will be turning over its receivables in 30 days. If that occurs with every sale, the receivables turnover ratio will be approximately 12.2 times per year (365 days / 30 days).
However, if all customers take 40 days to pay the amount owed, the receivables turnover ratio will be approximately 9.1 times per year (365 days / 40 days).
The higher the receivables turnover ratio, the faster the receivables are turning into cash (which is necessary for the company to pay its current liabilities on time). Therefore, a higher receivables turnover ratio is better than a lower ratio.
Some people categorize the receivables turnover ratio as an efficiency ratio since it indicates the speed in which the company had collected its accounts receivables and turned them into cash.
The receivables turnover ratio is calculated as follows:
Receivables turnover ratio = net credit sales for the year / average amount in accounts receivable
Example 10
Assume that a company competes in an industry where customers are given credit terms of net 30 days. Also assume that the company had $570,000 of net credit sales during the most recent year and on average it had accounts receivable during the year of $60,000.
Given this information, the company’s receivables turnover ratio is:
Receivables turnover ratio = net credit sales for the year / avg. amount of accounts receivable
Receivables turnover ratio = $570,000 / $60,000
Receivables turnover ratio = 9.5 times
To determine if this company’s receivables turnover ratio of 9.5 is acceptable or not acceptable, you could do the following:
- Look at the average receivables turnover ratio for the company’s industry
- Calculate a competitor’s receivables turnover ratio
- Compare it to the company’s past receivables turnover ratios
- Compare it to the expected ratio for the credit terms given to its customers
The larger the number of times that the receivables turn over during the year, the more often the company collects the cash it needs to pay its current liabilities.
NOTE:
If you are computing the receivables turnover ratio by using a corporation’s published (external) financial statements, you should be aware of the following:
-
Typically, the income statement does not report the amount of net credit sales as a separate amount. Instead, only the amount of net sales (credit sales + cash sales) will be available.
In our examples, we will provide the amount of a corporation’s net credit sales.
-
The balance sheet reports the corporation’s accounts receivable only at the final moment of the accounting year (and usually the balance at the final moment of the previous year). The average balance in accounts receivable throughout the year is not reported.
As a result, an average balance in accounts receivable must be calculated. Since people outside of the corporation do not have access to the daily, weekly, or monthly balances, they often calculate a simple average based on the two balances as of the final moment of each accounting year. (This average could be much lower than the balances throughout the year since U.S. corporations often end their accounting years when their business activity is at the lowest levels.)
In our examples, we will provide the average amount of a corporation’s accounts receivable throughout the accounting year.
Ratio #11 Days’ Sales in Receivables (Average Collection Period)
The days’ sales in receivables (also known as the average collection period) indicates the average amount of time it took in the past year for a company to collect its accounts receivable.
An easy way to determine the number of days’ sales in receivables is to divide 365 (the days in a year) by the receivables turnover ratio, which was explained in Ratio #10. In other words, the formula for the days’ sales in receivables is:
Days’ sales in receivables = 365 days / receivables turnover ratio
Example 11
Assume that a company had $570,000 of net credit sales during the most recent year. During the year it had an average of $60,000 of accounts receivable. As a result, its receivables turnover ratio was 9.5 times per year ($570,000 / $60,000).
Since the company’s receivables turnover ratio was determined to be 9.5, the days’ sales in receivables is calculated as follows:
Days’ sales in receivables = 365 days / receivables turnover ratio
Days’ sales in receivables = 365 days / 9.5
Days’ sales in receivables = 38.4 days
To determine whether this company’s days’ sales in receivables of 38.4 days is acceptable (or not acceptable), you could do the following:
- Look at the average receivables turnover ratio for the company’s industry
- Calculate a competitor’s receivables turnover ratio
- Compare it to the company’s past receivables turnover ratios
- Compare it to the expected ratio for the credit terms given to its customers
Having a smaller number of days’ sales in receivables means that on average, the company is converting its receivables into the cash needed to pay its current liabilities.
NOTE:
The days’ sales in receivables (such as the 38.4 days we just calculated) was based on all customers’ transactions and unpaid balances. It includes the credit sales made a few days ago, 25 days ago, 50 days ago, 75 days ago, etc. Therefore, the average of 38.4 could be concealing some slow-paying customers’ accounts.
Instead of using one of the receivables ratios, it would be better to have an aging of accounts receivable (which is readily available with accounting software). The aging of accounts receivable sorts each customer’s unpaid balance into columns which have headings such as: Current, 1-30 days past due, 31-60 days past due, 61-90 days past due, 91+ days past due. This aging report allows a company’s personnel to see the exact amount(s) owed by each customer. As a result, the company can take action to collect the past due amounts.
Ratio #12 Inventory Turnover Ratio
The inventory turnover ratio indicates the speed at which a company’s inventory of goods was sold during the past year. Since inventory is reported on a company’s balance sheet at its cost (not selling prices), it is necessary to relate the inventory cost to the cost of goods sold (not sales) reported on the company’s income statement.
Since the cost of goods sold is the cumulative cost for all 365 days during the year, it is important to relate it to the average inventory cost throughout the year.
Because a company’s published balance sheet reports only the inventory cost at the final moment of the accounting year and the final moment of the prior accounting year, the average of these two data points may not be representative of the inventory levels throughout the 365 days of the year. (The reason is that many U.S. corporations end their accounting year at the lowest levels of activity.) In our examples, we will provide you with the company’s average cost of inventory that is representative of the entire year.
Here is the formula for the inventory turnover ratio:
Inventory turnover ratio = cost of goods sold for the year / average cost of inventory during the year
Since there are risks and costs associated with holding inventory, companies strive for a high inventory turnover ratio, so long as its inventory items are never out of stock.
Example 12
Assume that during the most recent accounting year, a company had sales of $420,000 and its cost of goods sold was $280,000. Also assume that the company’s balance sheet at the end of the year reported the cost of its inventory as $75,000 and was $65,000 at the end of the previous year. An analysis of the company’s inventory records indicates that inventory cost increased steadily throughout the year. Based on the analysis, the average inventory cost during the accounting year was determined to be $70,000. Given this information, the company’s inventory turnover ratio for the recent accounting year was:
Inventory turnover ratio = cost of goods sold for the year / avg. cost of inventory during the year
Inventory turnover ratio = $280,000 / $70,000
Inventory turnover ratio = 4 times in the year
To determine whether this company’s inventory turnover ratio of 4 is acceptable or not acceptable, you could do the following:
- Look at the average inventory turnover ratio for the company’s industry
- Calculate a competitor’s inventory turnover ratio
- Compare it to the company’s past inventory turnover ratios
- Compare it to the expected inventory turnover ratio
The inventory turnover ratio is an average of perhaps hundreds of different products and component parts carried in inventory. Some items in inventory may not have had any sales in more than a year, some may not have had sales in six months, some may sell within weeks of arriving from the suppliers, etc.
Here’s a Tip
Rather than relying on the average turnover ratio for the entire inventory, a company’s managers could calculate a turnover ratio for each product it has in inventory. For example, the average quantity/units of its Item #123 in inventory would be compared to the quantity/units of Item #123 that were sold during the year.
A simple worksheet would list every item in inventory and then calculate each item’s approximate inventory turnover ratio. The formula is: the number of units sold during the past year / the number of units in inventory. The slow-moving items (those with low inventory turnover ratios) would then be reviewed to determine whether it is profitable to continue carrying these items.
An additional column could be added to the worksheet to show the days’ sales in inventory (Ratio #13 which follows).
Ratio #13 Days’ Sales in Inventory (Days to Sell)
The days’ sales in inventory (also known as days to sell) indicates the average number of days that it took for a company to sell its inventory. The goal is to have the fewest number of days of inventory on hand because of the high cost of carrying items in inventory (including the risk of items spoiling or becoming obsolete). Of course, there is also a cost for being out of stock. Therefore, managing inventory levels is important.
An easy way to calculate the number of days’ sales in inventory is to divide 365 (the days in a year) by the inventory turnover ratio (Ratio #12).
Here is the formula for calculating the days’ sales in inventory:
Days’ sales in inventory = 365 days / inventory turnover ratio
Example 13
Assume that a company’s cost of goods sold for the year was $280,000 and its average inventory cost for the year was $70,000. Therefore, its inventory turnover ratio was 4 times during the year ($280,000 / $70,000).
Given that the company’s inventory turnover ratio was 4, the days’ sales in inventory is calculated as follows:
Days’ sales in inventory = 365 days / inventory turnover ratio
Days’ sales in inventory = 365 days / 4
Days’ sales in inventory = 91.25 days
A smaller number of days’ sales in inventory is preferred, since it indicates the company will be converting its inventory to cash sooner. (It may get cash immediately for cash sales, or it will get cash when the resulting receivables are collected.)
The days’ sales in inventory is an average of the many products that a company had in inventory. Some of the products may not have been sold in more than a year, some may not have been sold in 10 months, some were sold shortly after arriving from the suppliers, etc.
Since we used the inventory turnover ratio to calculate the days’ sales in inventory, a mistake in calculating the inventory turnover ratio will result in an incorrect number of days’ sales in inventory. (For instance, if someone uses sales instead of the cost of goods sold to calculate the inventory turnover ratio, the days’ sales in inventory will not be accurate.)
Ratio #14 Return on Stockholders’ Equity
For a corporation that has only common stock (no preferred stock) outstanding, the return on stockholders’ equity is calculated by dividing its earnings (net income after tax) for a year by the average amount of stockholders’ equity during the same year.
The amount of stockholders’ equity reported on a corporation’s balance sheet is the amount as of the final moment of the accounting year. On the other hand, the net income after tax is the cumulative amount earned throughout the entire year. Therefore, the calculation of the return on stockholders’ equity ratio should use the average amount of stockholders’ equity throughout the year.
The formula for the annual return on stockholders’ equity for a corporation with only common stock is:
Return on stockholders’ equity = net income after tax / average stockholders’ equity
Example 14
Assume that during the past year a corporation had net income after tax (earnings) of $560,000. It was determined that a representative average amount of stockholders’ equity during the year was $2,800,000. Given this information, the corporation’s return on stockholders’ equity for the past year was:
Return on stockholders’ equity = net income after tax / average stockholders’ equity
Return on stockholders’ equity = $560,000 / $2,800,000
Return on stockholders’ equity = 20%
To determine whether a corporation’s return on stockholders’ equity is reasonable, you could do the following:
- Look at the average return on stockholders’ equity for the corporation’s industry
- Calculate a competitor’s return on stockholders’ equity
- Compare it to the corporation’s return on stockholders’ equity in recent years
- Compare it to the planned return on stockholders’ equity
Financial Ratios Using Cash Flow Statement Amounts
The cash flow statement, or statement of cash flows (SCF), is one of the five financial statements required by U.S. accounting rules. Since the income statement and balance sheet are prepared using the accrual method of accounting, the SCF provides the following desired information on a company’s cash flows:
-
Cash inflows and amounts that are good for the company’s cash balance. These are reported as positive amounts on the SCF.
-
Cash outflows and amounts that are not good for the company’s cash balance. These amounts are reported in parentheses to indicate their negative effect on the company’s cash.
The SCF is organized into three main sections:
- Cash flows from operating activities (or operations)
- Cash flows from investing activities
- Cash flows from financing activities
A commonly cited metric that is derived from the SCF is the amount of free cash flow.
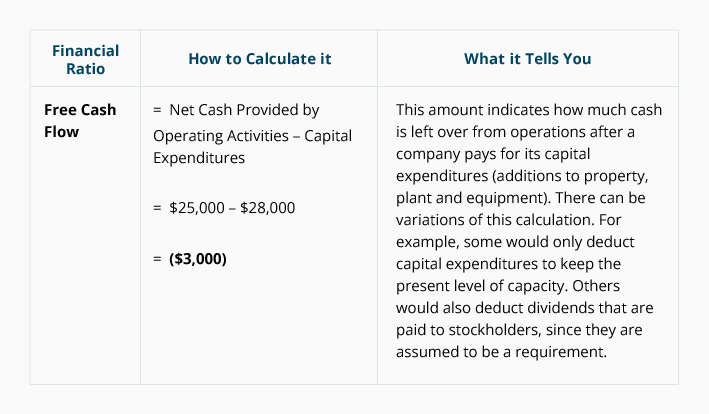
Ratio #15 Free Cash Flow
Free cash flow is calculated from the following amounts reported on the statement of cash flows:
-
The total of the SCF section having the heading cash flows from operating activities. This total is described on the SCF as net cash provided by operating activities.
-
The amount described as capital expenditures or purchase of property, plant and equipment. This amount is reported in the SCF section having the heading cash flows from investing activities. Since this is an outflow of cash, the amount of the capital expenditures appears in parentheses.
To arrive at the amount of free cash flow, the amount of capital expenditures is subtracted from the net cash provided by operating activities.
Therefore, the formula for calculating a company’s free cash flow is:
Free cash flow = net cash provided by operating activities – capital expenditures
Example 15
Assume that a corporation had net cash provided by operating activities of $200,000 and had capital expenditures of $140,000. The corporation’s free cash flow is calculated as follows:
Free cash flow = net cash provided by operating activities – capital expenditures
Free cash flow = $200,000 – $140,000
Free cash flow = $60,000
If a corporation considers its cash dividends paid to stockholders to be a requirement, the corporation could also subtract the required dividend amount. If the stockholders of the corporation in our example demand a constant dividend of $25,000 each year, the corporation’s free cash flow will be $35,000 ($200,000 – $140,000 – $25,000).
Whether the amount of the corporation’s free cash flow is adequate depends on its plans for the near future.
NOTE:
Many financial analysts compare 1) the amount of a corporation’s net cash provided by operating activities, with 2) the corporation’s earnings (net income after tax). Generally, they expect the corporation’s net cash provided by its operating activities (or operations) to be greater than the corporation’s earnings since depreciation expense reduced earnings but did not use cash.
If a corporation’s net cash provided by operating activities is less than its earnings, it raises some concern. The sophisticated investor or financial analyst will seek to find the reason. One possibility is that customers who purchased goods with credit terms have not remitted the amounts owed. Could the reason be that the goods were not acceptable? Another possibility is the corporation made large purchases of goods, but the goods have not sold. A good analyst would be curious why the goods could not be sold.
To learn more about this important financial statement, visit our Cash Flow Statement Explanation.
Other Financial Ratios
Included in our Business Forms (available when you join PRO) are forms to assist in calculating the following 24 financial ratios:
- Working capital
- Working capital to total assets
- Working capital turnover ratio
- Current ratio
- Quick ratio (acid test ratio)
- Accounts receivable turnover ratio
- Days’ sales in accounts receivable
- Inventory turnover ratio
- Days’ sales in inventory
- Fixed assets turnover ratio
- Total assets turnover ratio
- Debt to total assets ratio
- Debt to equity ratio
- Equity ratio
- Equity turnover ratio
- Times interest earned
- Profit margin after tax
- Gross profit margin
- Return on total assets
- Return on stockholders’ equity
- EBITDA
- Book value per share of common stock
- Free cash flow
- Cash flow to debt ratio
Benefits and Limitations of Financial Ratios
Benefits of Financial Ratios
Some of the benefits of financial ratios include:
-
Provides a way to compare a company’s financial information with individual companies in the same industry or with industry averages
-
Provides a way for a company to monitor its key financial information over time
-
Provides some benchmarks to assist a company in planning for future financing needs
Limitations of Financial Ratios
While financial ratios can be beneficial, it is important to consider their limitations:
-
A company’s financial ratios are not comparable to the ratios of companies in different industries, or with consolidated financial statements of companies operating in several industries.
-
Generally, financial ratios are based on a company’s financial statements from a recent year. This means that the ratios are a representation of an enormous amount of past transactions (some from more than a year ago and no longer relevant).
-
The financial statements, and therefore the resulting ratios, reflect the cost principle. This means that some valuable assets may not be included in the company’s balance sheet. Examples include brand or trade names, logos, customers’ allegiance, innovative management, dominant market position, etc. which have been developed by the company (not purchased from another company).
-
U.S. companies (even those in the same industry) may apply accounting principles differently. For instance, one company may use the FIFO cost flow assumption for assigning costs to its inventory and its cost of goods sold, while another company uses LIFO. Some companies apply accounting principles in the most conservative way possible, while another applies them in the opposite manner.
-
Reviewing financial ratios derived from a few amounts appearing on past financial statements is not the same as studying the company’s five required financial statements. It is also far different from reading a publicly traded corporation’s Management’s Discussion and Analysis (found in its annual report to the Securities and Exchange Commission, Form 10-K).
-
Financial ratios for accounts receivable and inventory (and others) are averages and therefore can be concealing some not-so-favorable details.
-
A company’s efforts to improve one financial ratio can lead to adverse effects on the business and on other financial ratios.
Vertical Analysis
Typically, accounting software allows for a percentage to be printed next to all of the amounts on the company’s financial statements.
For instance, a company’s internal income statement will contain more detail and often displays a percent next to each dollar amount. The percent is the result of dividing each amount by the amount of the company’s net sales.
The company’s internal balance sheet will also show more detail and often displays a percent next to each dollar amount. The percent is the result of dividing each amount by the amount of the company’s total assets.
Expressing every income statement amount as a percent of net sales, and every balance sheet amount as a percent of total assets is referred to as vertical analysis.
When the financial statements are presented as percentages, they are referred to as common-size financial statements. They are “common size” since the reported percentages can be compared to the percentages for other companies even when the companies’ amounts are vastly different in size.
Common-size income statement resulting from vertical analysis
You can immediately find on the following multiple-step, common-size income statement (with dollar amounts omitted) the company’s gross margin of 24.0%, its profit margin before tax of 5.6%, and its profit margin after tax of 4.6%.

Common-size balance sheet resulting from vertical analysis
As you can see from the following common-size balance sheet (with amounts omitted) each item is expressed as a percent of the company’s total assets.

The percentages on the common-size balance sheet (above) allow you to immediately see that the debt to total asset ratio is 62.5% (the amount of total liabilities was divided by the amount of total assets).
You can also see that stockholders’ equity provided 37.5% of the total asset amount, and that the reported amount of property, plant and equipment after deducting accumulated depreciation was 43.7% of the amount of the corporation’s total assets.
The percentages shown on a company’s common-size balance sheet allows you to compare them to other companies’ percentages even if the companies’ amounts are vastly different in size.
Horizontal Analysis
Horizontal analysis shows a financial statement amount over a minimum of two years.
Comparative financial statements
Corporations’ published financial statements are referred to as comparative financial statements since they are required to display not only the most recent year’s amounts but must also display the corresponding amounts for the prior year or the prior two years. (It is rare for the external financial statements to display the percentages we discussed under vertical analysis.)
When a corporation publishes its financial statements, the following financial statements should report three columns of amounts (such as the amounts for the year 2025 and the corresponding amounts for 2024, and 2023):
The published balance sheet of a corporation must also be comparative but requires only two columns of amounts (such as the amounts as of December 31, 2025 and the corresponding amounts for December 31, 2024).
You can view comparative financial statements by doing an internet search for a corporation whose stock is publicly traded. For example, you could search for Apple form 10-K, Tootsie Roll form 10-K, etc., and then locate financial statements in the Form 10-K’s table of contents. (Form 10-K is part of the corporation’s annual filing with the SEC. The corporation’s 10-K is also accessible by using the corporation’s link entitled Investor Relations.)
Trend analysis or time series analysis
When horizontal analysis involves comparing amounts from more than two years, it may be referred to as trend analysis (or time series analysis).
The following table is an example of a trend analysis in which the amounts for the most recent five years are compared:

Financial Ratios Practice Calculations
Now that you have learned about 15 of the more common financial ratios, we want you to experience calculating them by using the amounts in a corporation’s financial statements. This will deepen your understanding and will help your retention for future use.
The financial ratios to be calculated are arranged in the same order as they were discussed above:
- Financial ratios using amounts from the balance sheet
- Financial ratios using amounts from the income statement
- Financial ratios using amounts from the balance sheet and income statement
- Financial ratio using amounts from the statement of cash flows
Calculating the Ratios Using Amounts from the Balance Sheet
You will be using the following balance sheet to calculate the first group of financial ratios:
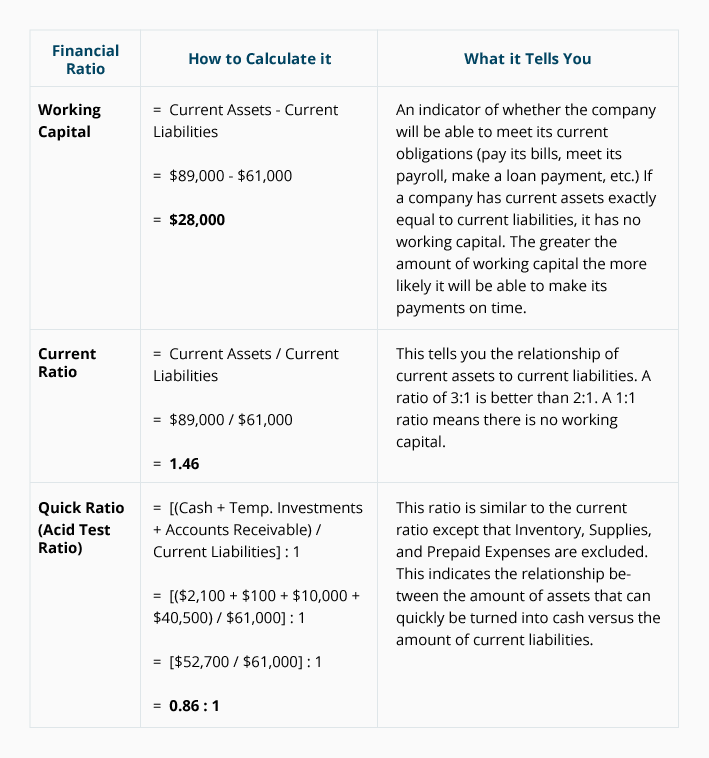
Calculations of Working Capital, Current Ratio, and Quick Ratio
Use the amounts in Example Corporation’s balance sheet (above) to calculate the following financial ratios:
-
Working capital as of December 31, 2025: $____________
-
Current ratio as of December 31, 2025: ______: 1
-
Quick ratio as of December 31, 2025: ______: 1
You can check your answers using the following table:

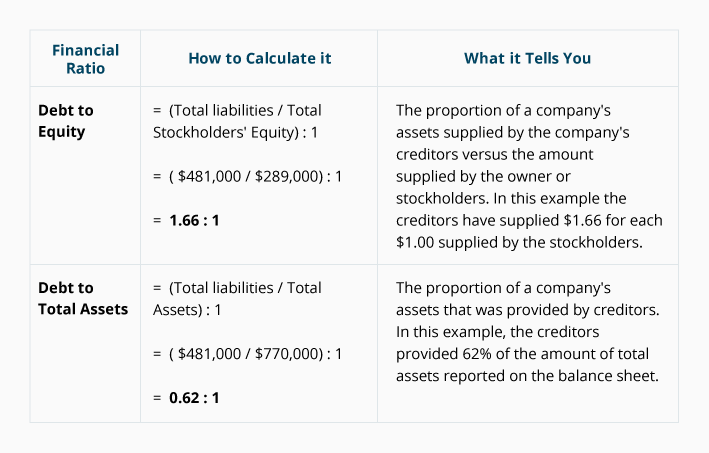
Calculations of Debt to Equity and Debt to Total Assets Ratios
Continue using the amounts in Example Corporation’s balance sheet to compute these two financial ratios:
-
Debt to equity ratio as of December 31, 2025: __________
-
Debt to total assets ratio as of December 31, 2025: _________
You can check your answers using the following table:

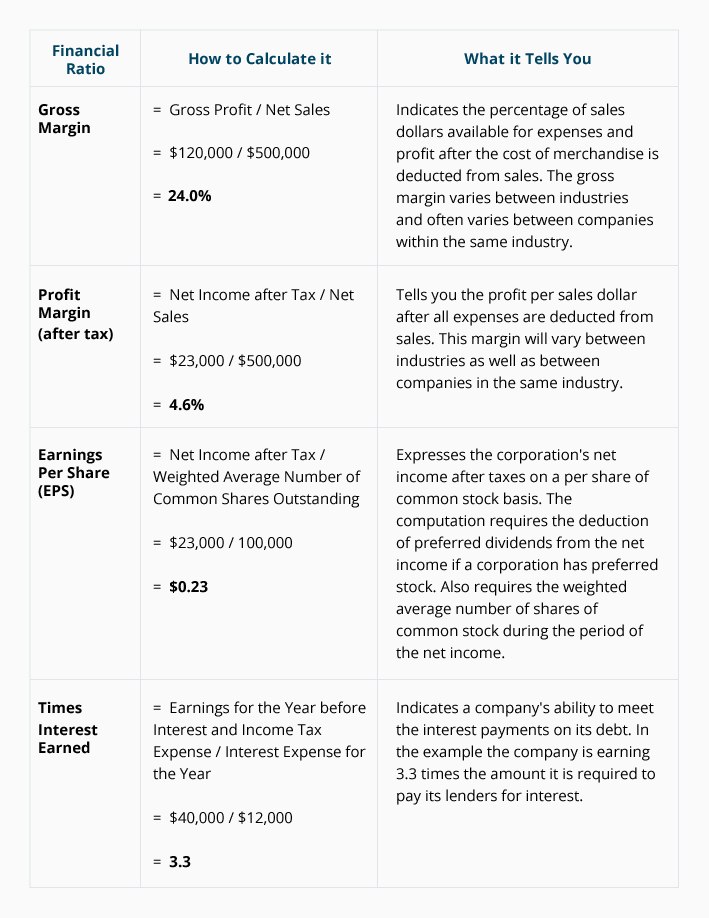
Calculating the Ratios Using Amounts from the Income Statement
The following income statement for Example Corporation should be used to calculate the four financial ratios which appear beneath it:

Calculations of Gross Margin, Profit Margin, Earnings Per Share, and Times Interest Earned
Use the amounts in Example Corporation’s income statement (above) to compute these financial ratios:
-
Gross margin for the year ended December 31, 2025: __________
-
Profit margin for the year ended December 31, 2025: __________
-
Earnings per share for the year ended December 31, 2025: ________
-
Times interest earned for the year ended December 31, 2025: ________
You can check your answers using the following table:

Calculating the Ratios Using an Amount from the Balance Sheet and the Income Statement
Financial ratios such as the “turnover” ratios and the “return on” ratios will need 1) an amount from the annual income statement, and 2) an average balance sheet amount.
An average balance sheet amount is needed since the balance sheet reports the amount for only the final moment of the accounting year. For the required calculations that follow, we indicate the average balance sheet amount.
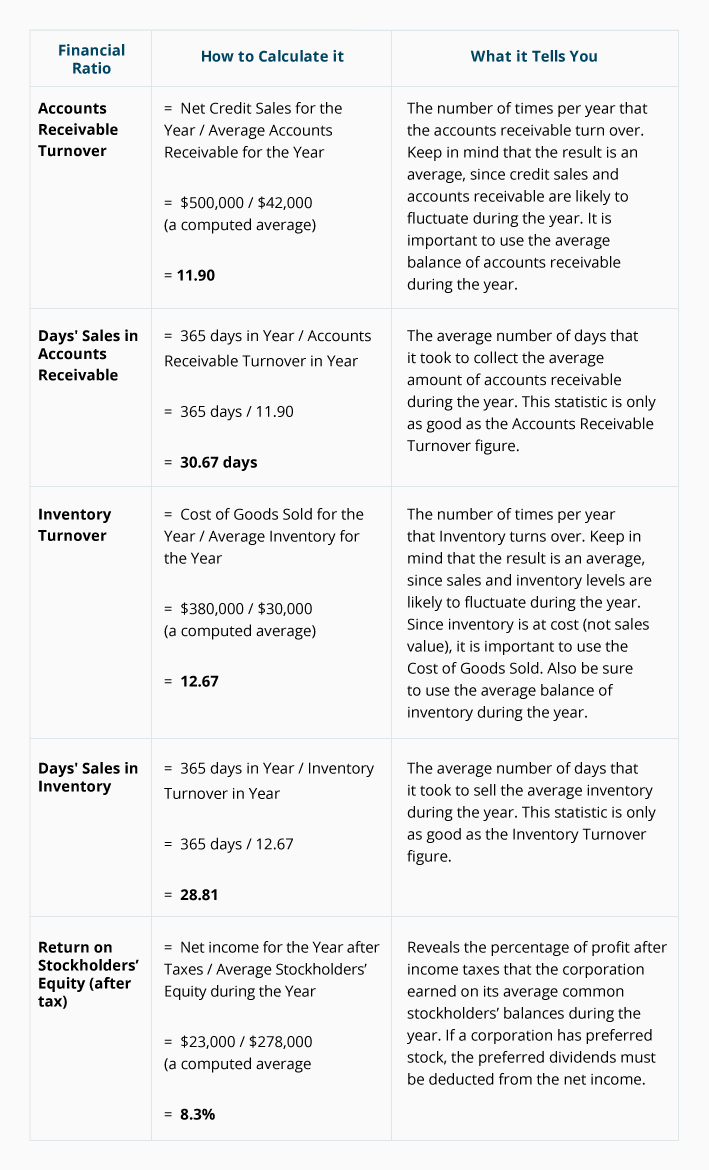
Calculations of the Ratios: Receivables Turnover, Day’s Sales in Receivables, Inventory Turnover, Days’ Sales in Inventory, Return on Stockholders’ Equity
Calculate the following ratios using Example Corporation’s income statement and our calculated average balance sheet amounts* which are included in the following questions:
-
Receivables turnover ratio for the year 2025 assuming the average* accounts receivable balance during the year was computed to be $42,000: __________
-
Days’ sales in receivables (average collection period) for the year 2025: __________
-
Inventory turnover ratio for the year 2025 assuming that the average* inventory balance during the year was computed to be $30,000: _________
-
Days’ sales in inventory (days to sell) for the year 2025: _________
-
Return on stockholders’ equity for the year 2025 assuming that the average* stockholders’ equity balance during the year was computed to be $278,000: _________
*We are providing the average balance sheet amounts based on the corporation’s internal records for all days in 2025. Using only the balance sheet amount from the final moment of 2025 (or the average of the final moment of 2024 and 2025) may not be typical of the balance sheet amount for all 365 days in the year.
You can check your answers using the following table:

Calculating a Ratio Using Amounts from the Statement of Cash Flows
Use the following statement of cash flows (SCF) for the related ratio calculation appearing after the SCF:

Calculation of Free Cash Flow
Using Example Corporation’s statement of cash flows (above), the amount of the corporation’s free cash flow for the year 2025 was ________________.
You can check your answer using the following table:

Where to Go From Here
We recommend taking our Practice Quiz next, and then continuing with the rest of our Financial Ratios materials (see the full outline below).
We also recommend joining PRO to unlock our premium materials (certificates of achievement, video training, flashcards, visual tutorials, quick tests, quick tests with coaching, cheat sheets, guides, puzzles, business forms, printable PDF files, progress tracking, badges, points, medal rankings, activity streaks, public profile pages, and more).
Disclaimer
You should consider our materials to be an introduction to selected accounting and bookkeeping topics (with complexities likely omitted). We focus on financial statement reporting and do not discuss how that differs from income tax reporting. Therefore, you should always consult with accounting and tax professionals for assistance with your specific circumstances.

Earn Our Certificate
for This Topic
When you join PRO, you will receive instant access to 16 different Certificates of Achievement plus our Bookkeeping Certificate of Excellence.
View PRO Features