Introduction
A person starting a new business often asks, “At what level of sales will my company make a profit?” Established companies that have suffered through some rough years might have a similar question. Others ask, “At what point will I be able to draw a fair salary from my company?” Our discussion of break-even point and break-even analysis will provide a thought process that may help to answer those questions and to provide some insight as to how profits change as sales increase or decrease.
Frankly, predicting a precise amount of sales or profits is nearly impossible due to a company’s many products (with varying degrees of profitability), the company’s many customers (with varying demands for service), and the interaction between price, promotion and the number of units sold. These and other factors will complicate the break-even analysis.
In spite of these real-world complexities, we will present a simple model or technique referred to by various names, including:
- break-even point
- break-even analysis
- break-even formula
- break-even model
- cost-volume-profit (CVP) analysis
- expense-volume-profit (EVP) analysis
The latter two names are appealing because the break-even technique can be adapted to determine the sales needed to attain a specified amount of profits. However, we will use the terms break-even point and break-even analysis.
To assist with our explanations, we will use a fictional company Oil Change Co. (a company that provides oil changes for automobiles). The amounts and assumptions used in Oil Change Co. are also fictional.
WATCH NOW
Advance Your Career with Our PRO Training
Expense Behavior
At the heart of break-even point or break-even analysis is the relationship between expenses and revenues. It is critical to know how expenses will change as sales increase or decrease. Some expenses will increase as sales increase, whereas some expenses will not change as sales increase or decrease.
Variable Expenses
Variable expenses increase when sales increase. They also decrease when sales decrease.
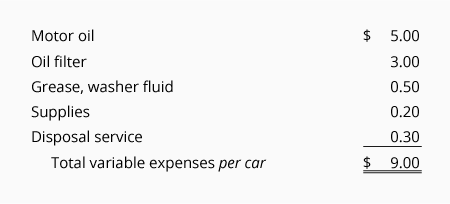
At Oil Change Co. the following items have been identified as variable expenses. Next to each item is the variable expense per car (per oil change):

The other expenses at Oil Change Co. (rent, heat, etc.) will not increase when an additional car is serviced.
For the reasons shown in the above list, Oil Change Co.’s variable expenses will be $9 if it services one car, $18 if it services two cars, $90 if it services 10 cars, $900 if it services 100 cars, etc.
Fixed Expenses
Fixed expenses do not increase when sales increase. Fixed expenses do not decrease when sales decrease. In other words, fixed expenses such as rent will not change when sales increase or decrease.
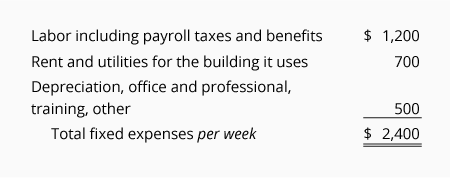
At Oil Change Co. the following items have been identified as fixed expenses. The amount shown is the fixed expense per week:

Mixed Expenses
Some expenses are part variable and part fixed. These are often referred to as mixed expenses or semi-variable expenses. An example would be a salesperson’s compensation that is composed of a salary portion (fixed expense) and a commission portion (variable expense). Mixed expenses could be split into two parts. The variable portion can be listed with other variable expenses and the fixed portion can be included with the other fixed expenses.
Revenues or Sales
Revenues (or sales) at Oil Change Co. are the amounts earned from servicing cars. Oil Change Co. charges one flat fee of $24 for performing the oil change service. For $24 the company changes the oil and filter, adds needed fluids, adds air to the tires, and inspects engine belts.
At the present time no other service is provided and the $24 fee is the same for all automobiles regardless of engine size.
As the result of its pricing, if Oil Change Co. services 10 cars its revenues (or sales) are $240. If it services 100 cars, its revenues will be $2,400.
Contribution Margin
An important term used with break-even point or break-even analysis is contribution margin. In equation format it is defined as follows:

The contribution margin for one unit of product or one unit of service is defined as:

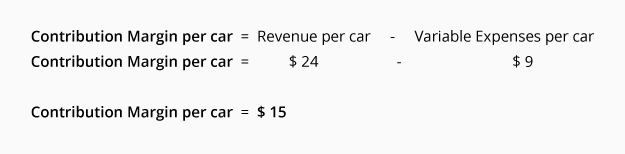
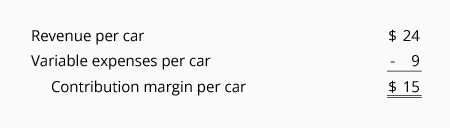
At Oil Change Co. the contribution margin per car (or per oil change) is computed as follows:

The contribution margin per car lets you know that after the variable expenses are covered, each car serviced will provide or contribute $15 toward the Oil Change Co.’s fixed expenses of $2,400 per week. After the $2,400 of weekly fixed expenses has been covered the company’s profit will increase by $15 per car serviced.
Break-even Point In Units
The break-even point in units for Oil Change Co. is the number of cars it needs to service in order to cover the company’s fixed and variable expenses. The break-even point formula is to divide the total amount of fixed costs by the contribution margin per car:

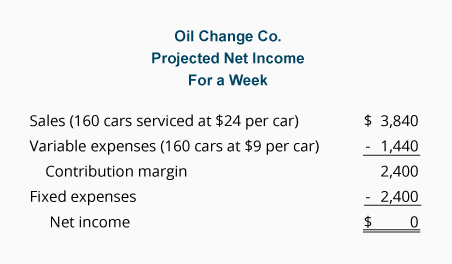
It’s always a good idea to check your calculations. The following schedule confirms that the break-even point is 160 cars per week:

Desired Profit In Units
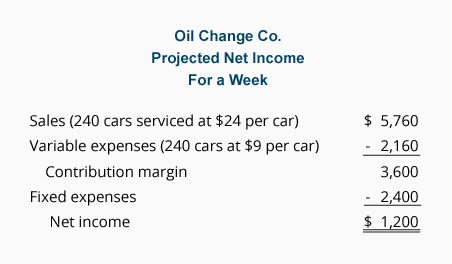
Let’s say that the owner of Oil Change Co. needs to earn a profit of $1,200 per week rather than merely breaking even. You can consider the owner’s required profit of $1,200 per week as another fixed expense. In other words, the fixed expenses will now be $3,600 per week (the $2,400 listed earlier plus the required $1,200 for the owner). The new point needed to earn $1,200 per week is shown by the following break-even formula:
Always check your calculations:
The above schedule confirms that servicing 240 cars during a week will result in the required $1,200 profit for the week.
Break-even Point In Sales Dollars
One can determine the break-even point in sales dollars (instead of units) by dividing the company’s total fixed expenses by the contribution margin ratio.
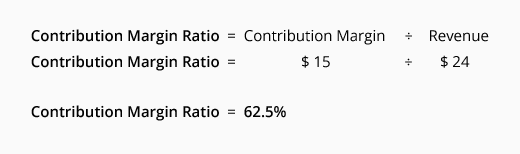
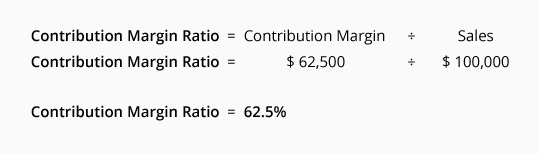
The contribution margin ratio is the contribution margin divided by sales (revenues). The ratio can be calculated using company totals or per unit amounts. We will compute the contribution margin ratio for the Oil Change Co. by using its per unit amounts:


The break-even point in sales dollars for Oil Change Co. is:

The break-even point of $3,840 of sales per week can be verified by referring back to the break-even point in units. Recall there were 160 units necessary to break-even. With revenues of $24 per unit, the necessary sales in dollars would be $3,840 (160 units x $24).
Desired Profit In Sales Dollars
Let’s assume a company needs to cover $2,400 of fixed expenses each week plus earn $1,200 of profit each week. In essence the company needs to cover the equivalent of $3,600 of fixed expenses each week.
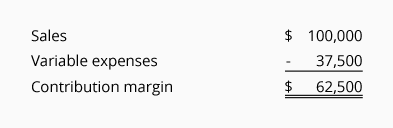
Presently the company has annual sales of $100,000 and its variable expenses amount to $37,500 per year. These two facts result in a contribution margin ratio of 62.5%:


The amount of sales necessary to give the owner a profit of $1,200 per week is determined by this break-even point formula:

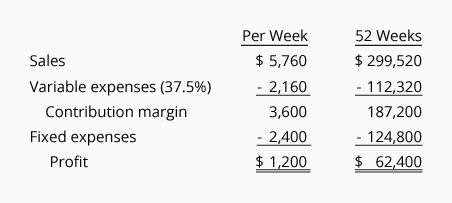
To verify that this answer is reasonable, we prepared the following schedule:

As you can see, for the owner to have a profit of $1,200 per week or $62,400 per year, the company’s annual sales must triple. Presently the annual sales are $100,000 but the sales need to be $299,520 per year in order for the annual profit to be $62,400.
Where to Go From Here
We recommend taking our Practice Quiz next, and then continuing with the rest of our Break-even Point materials (see the full outline below).
We also recommend joining PRO to unlock our premium materials (certificates of achievement, video training, flashcards, visual tutorials, quick tests, quick tests with coaching, cheat sheets, guides, puzzles, business forms, printable PDF files, progress tracking, badges, points, medal rankings, activity streaks, public profile pages, and more).
Disclaimer
You should consider our materials to be an introduction to selected accounting and bookkeeping topics (with complexities likely omitted). We focus on financial statement reporting and do not discuss how that differs from income tax reporting. Therefore, you should always consult with accounting and tax professionals for assistance with your specific circumstances.