Evaluating Business Investments
When someone is deciding to invest in business assets that have a life of more than one year, it is important that the time value of money be considered. The time value of money means that the dollars (or other currency) invested or paid today are more valuable than the dollars that will be received in the future years. The process of evaluating and deciding which long-lived assets will be made is referred to as capital budgeting and the amounts actually invested are referred to as capital expenditures.
We will discuss two models that consider the time value of money. They are:
- Net present value
- Internal rate of return
Both of these models are also referred to as discounted cash flow (DCF) models.
Discounting Future Cash Flows
To recognize the time value of money, the future cash flows are discounted to their “present value.” Discounting can be thought of as removing the interest or necessary earnings that is included in the future cash amounts. After the interest has been removed the resulting amount is the present value or the discounted cash amount. Depending on the purpose, the rate used for discounting the future cash amounts could be described as any of the following:
- desired rate of return
- target rate of return
- time value of money
- company’s cost of capital
- incremental interest rate of the borrower
- the inflation rate, etc.
Example 1. If a company will be receiving a single amount of $1,000 at the end of 5 years, its present value is only $621 (if the $1,000 is discounted by a target rate of 10% per year for 5 years). If the $1,000 is discounted by 12%, the present value is $567. If the $1,000 is discounted by 8%, the present value is $681.
Note that when the rate used for discounting increases, the present value of the future cash amounts will be smaller. In other words, if you need to earn a higher rate and the $1,000 is a fixed amount you need to invest a smaller amount.
Present Value Tables
In classrooms, textbooks, and in our explanation, the calculation of the present values will be done by using present value tables. If there is a stream of equal cash amounts occurring at equal time intervals, the present value of an annuity table can be used. When there is a single future amount, or when the future amounts are not uniform in amount or occur at various time intervals, the present value of 1 table is used. (However, using an online calculator or a financial calculator is more practical, precise and faster.)
Net Present Value Model
Net present value (NPV) is one of the discounted cash flow models used to evaluate investments in long-lived assets. In the NPV model, the future cash flows are discounted to their present values and then all of the present values (including the investment outflow of cash) are summed into a single amount. That single amount is known as the net present value.
Example 2. A company is deciding whether to pay out cash of $100,000 today in order to receive the following cash amounts at the end of each of the years 1 thru 5: $25,000 + $30,000 + $35,000 + $40,000 + $45,000. Since the $100,000 is occurring at the present time, its present value is $100,000. Next the 5 future amounts need to be discounted to their present value. The discounting of the future amounts by 10% per year is shown in the following table:
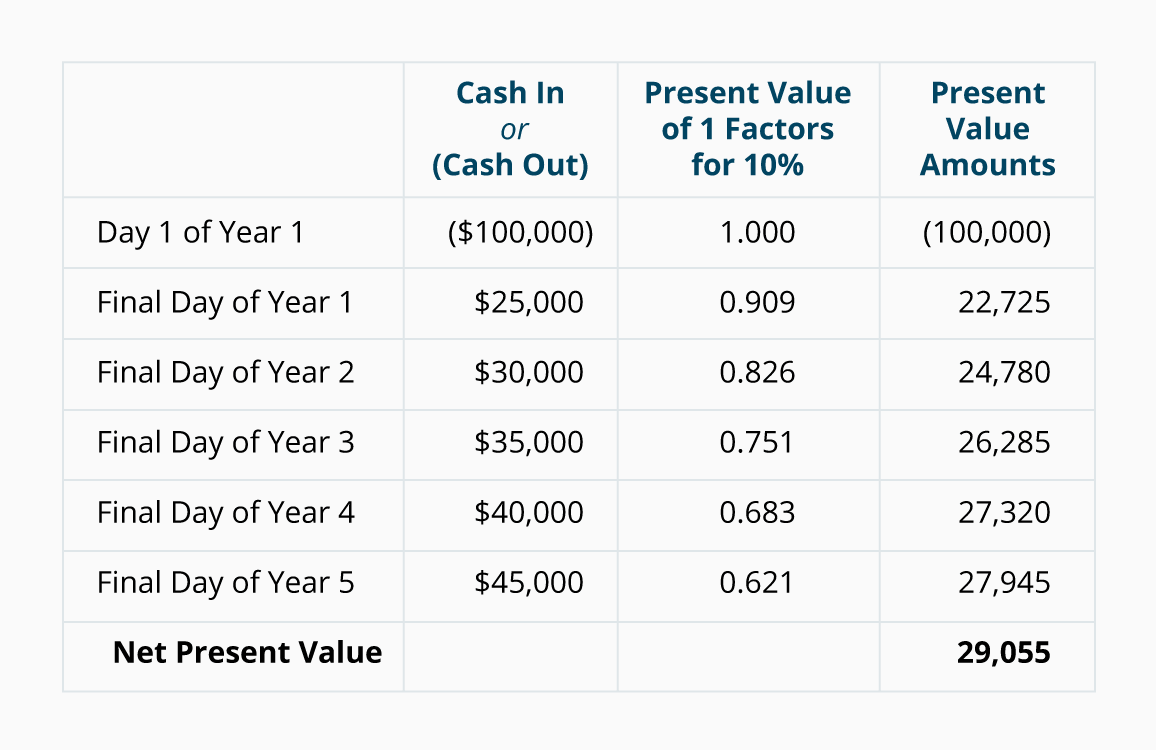
When the present value of the $100,000 cash outflow is combined with the present value of the five cash inflows we arrive at the net present value of 29,055. This positive present value indicates that the investment is earning significantly more than the 10% rate to discount the cash flows. (A net present value of $0 would indicate that the corporation was earning exactly 10%.)
Internal Rate of Return
The internal rate of return (IRR) is a discounted flow model that computes the exact rate of return earned on an investment. In other words, the internal rate of return tells you the rate that will discount all of the investment’s cash flows to a net present value of exactly $0. If a present value table is used, it requires a trial-and-error approach. If it is done online or with a financial calculator, the rate will appear with electronic speed.
Example 3. To illustrate the internal rate of return, we will use the same cash flows that were used in Example 2. First, recall that the net present value showed a positive 29,055. This relatively large net present value indicates that the internal rate of return will be significantly greater than the 10% rate used to calculate the net present value. As a result, we decided to discount the cash flows by 20%. The present value factors of a single amount for 20% are used in the following table:
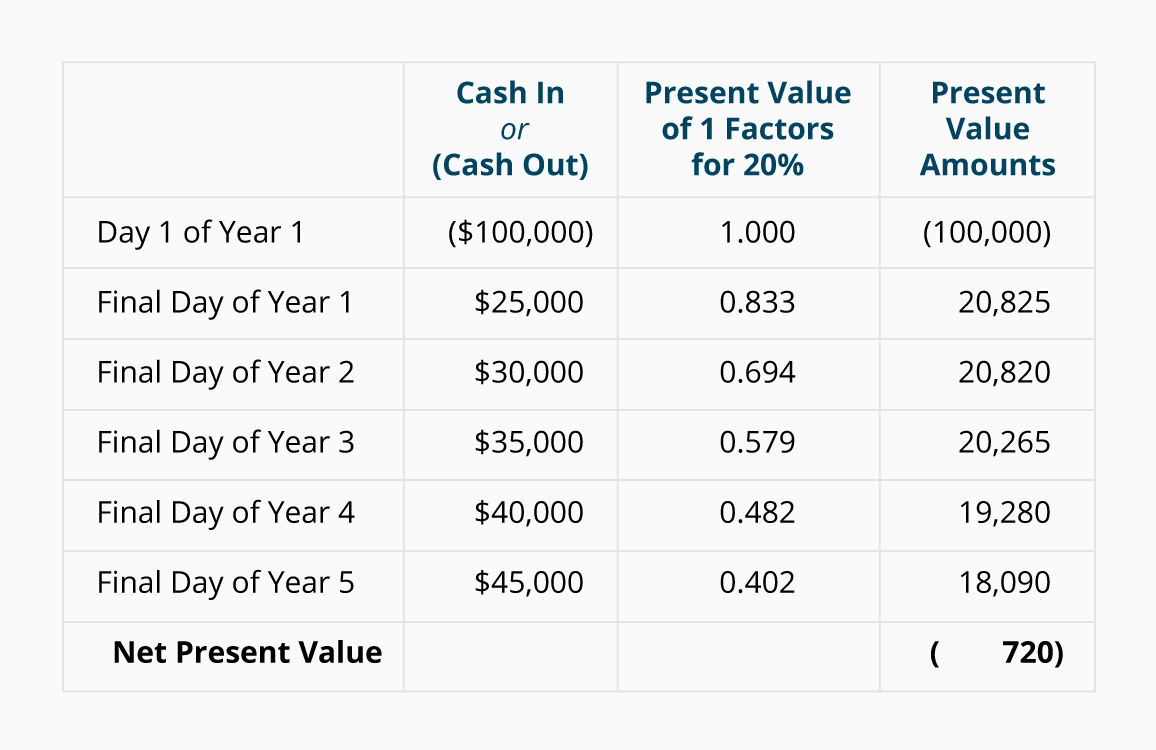
After discounting the cash flows by 20%, the net present value is (720). This relatively small amount indicates that the internal rate of return is very close to 20%. Since the amount is negative, the actual rate is less than 20% (as opposed to more than 20%). When an internal rate of return is calculated for each of the potential investments, the investments can be ranked from high to low.
Recap of NPV and IRR
Both the net present value (NPV) and the internal rate of return (IRR) models are recommended because of the following:
- Both use all of the cash flows that occur during the entire life of the investment
- Both recognize the time value of money (future amounts are discounted)
- Because the present value factors are very small in the future years, the estimated future amounts (which are difficult to predict) carry less weight than the more current amounts
Payback Period
Another model that is often used when evaluating business investments is the payback period. The payback period simply indicates the number of years it takes for a company to recover its investment. The payback period is easy to understand, but it has two drawbacks:
- The future cash amounts are not discounted to their present value. This means that the time value of money is ignored.
- The payback calculation does not consider all of the cash inflows. It merely looks at the cash flows until the investment is recovered.
Example 4. The following chart illustrates the payback period calculation. The amounts come from our earlier examples, except that the cash inflows are assumed to occur evenly throughout each of the five years.

As the chart indicates, the company will recover its $100,000 investment in 3.25 years. This is 3 full years plus $10,000 of the $40,000 in Year 4. Note that the payback period calculation ignored the following:
- $30,000 of the $40,000 occurring in Year 4, and
- $45,000 occurring in Year 5.